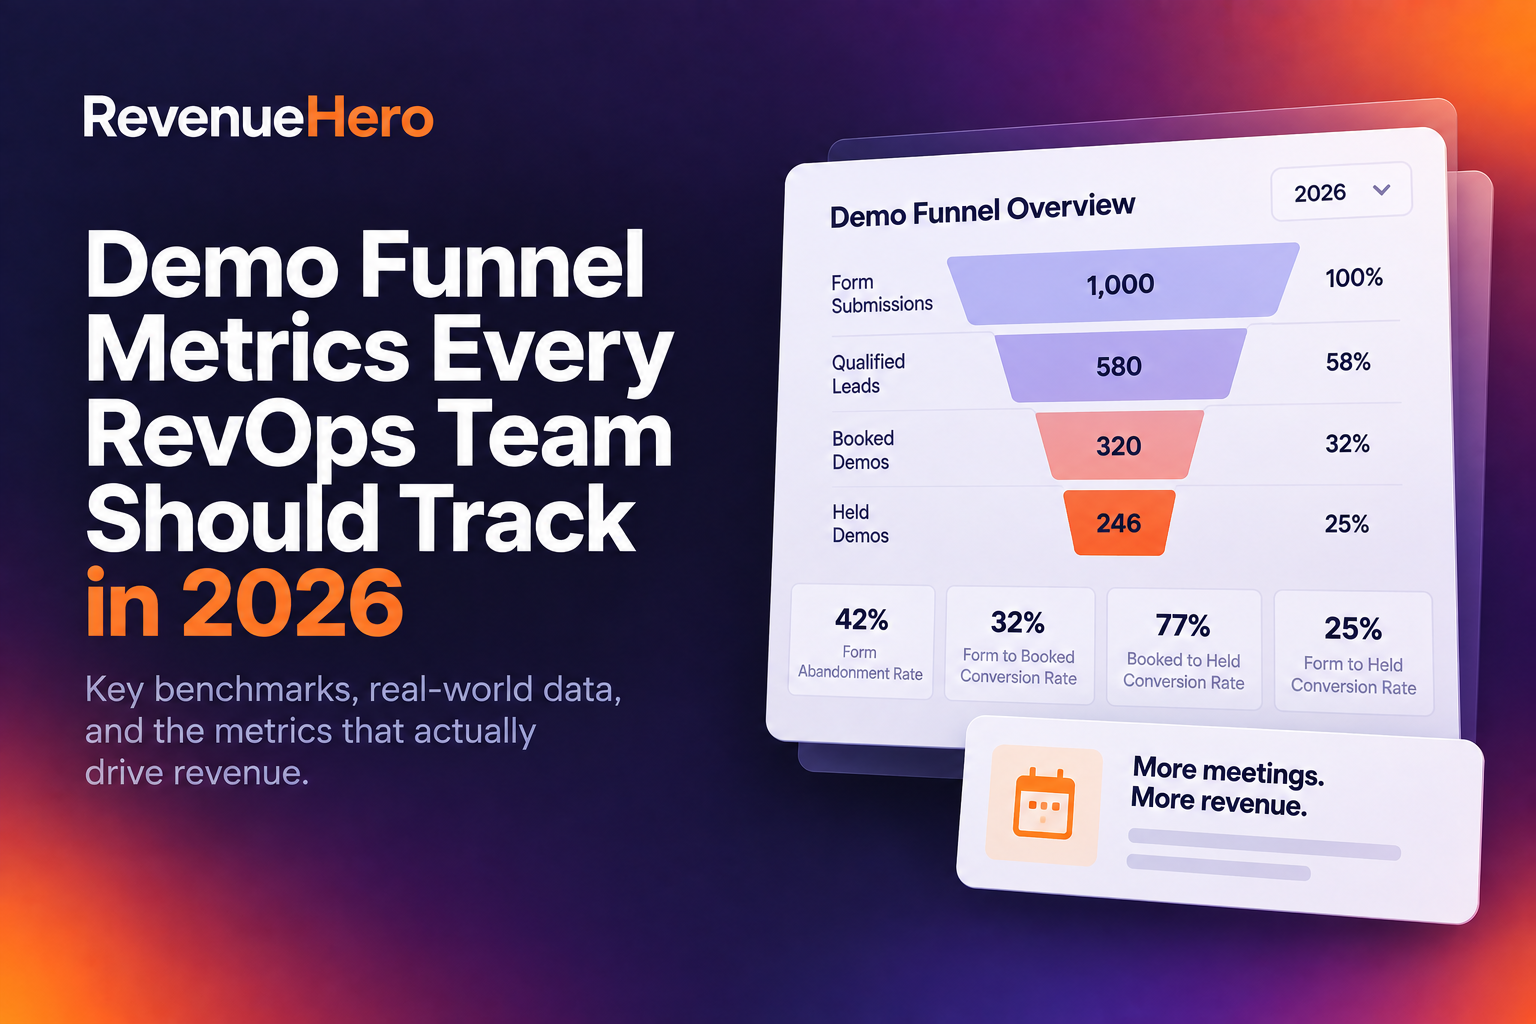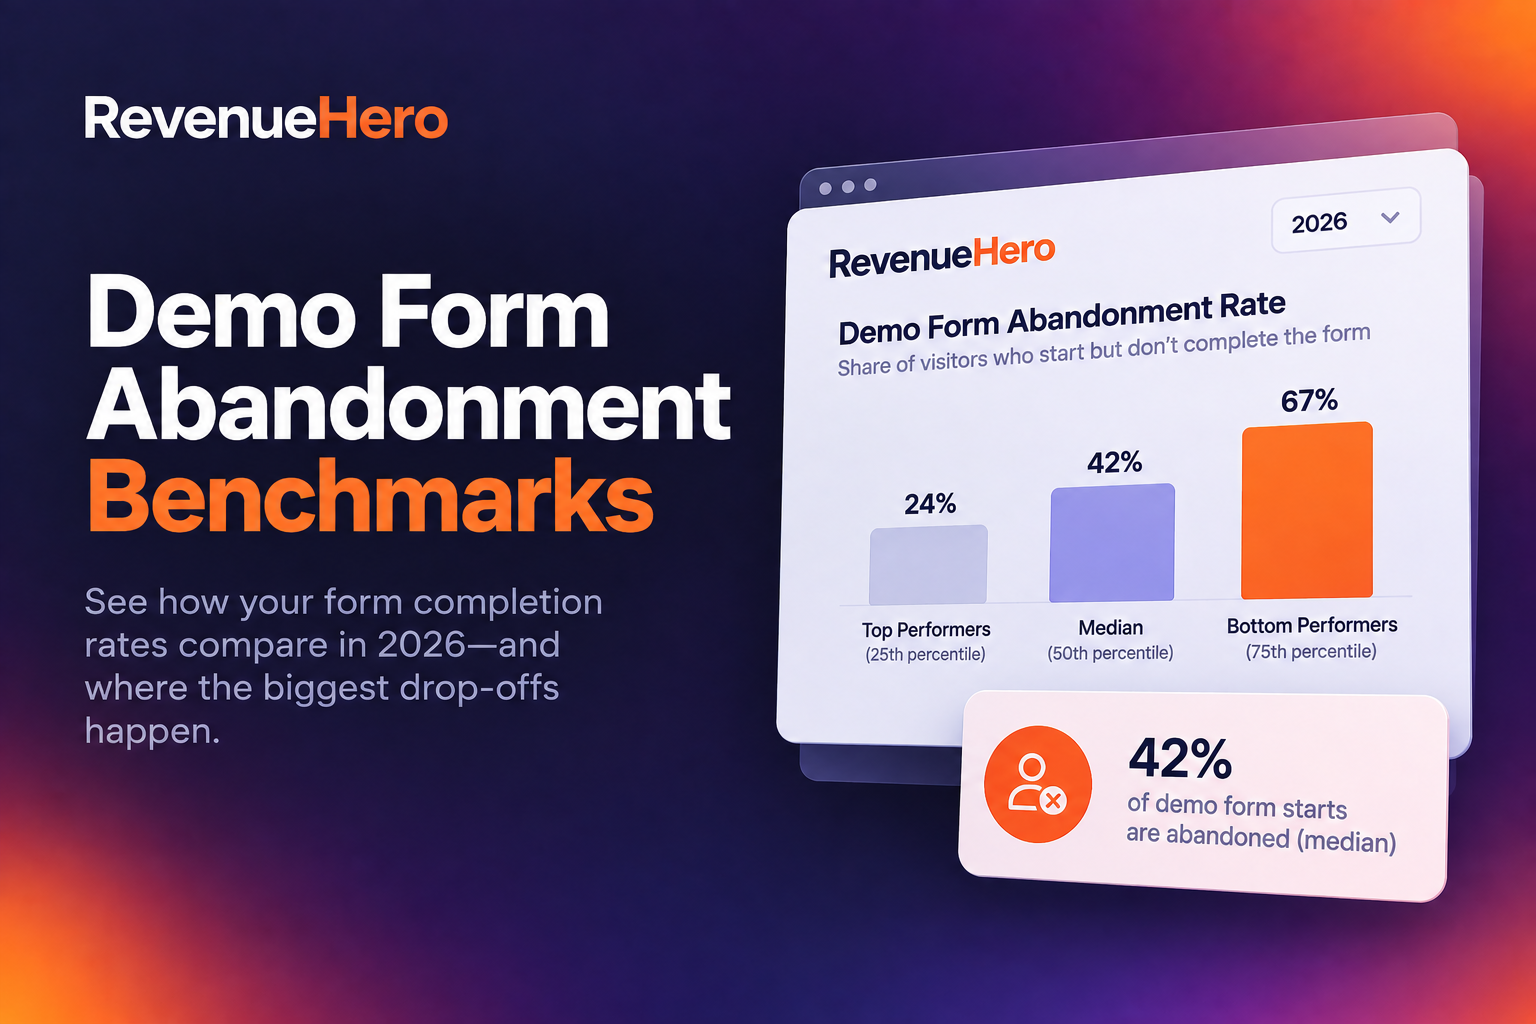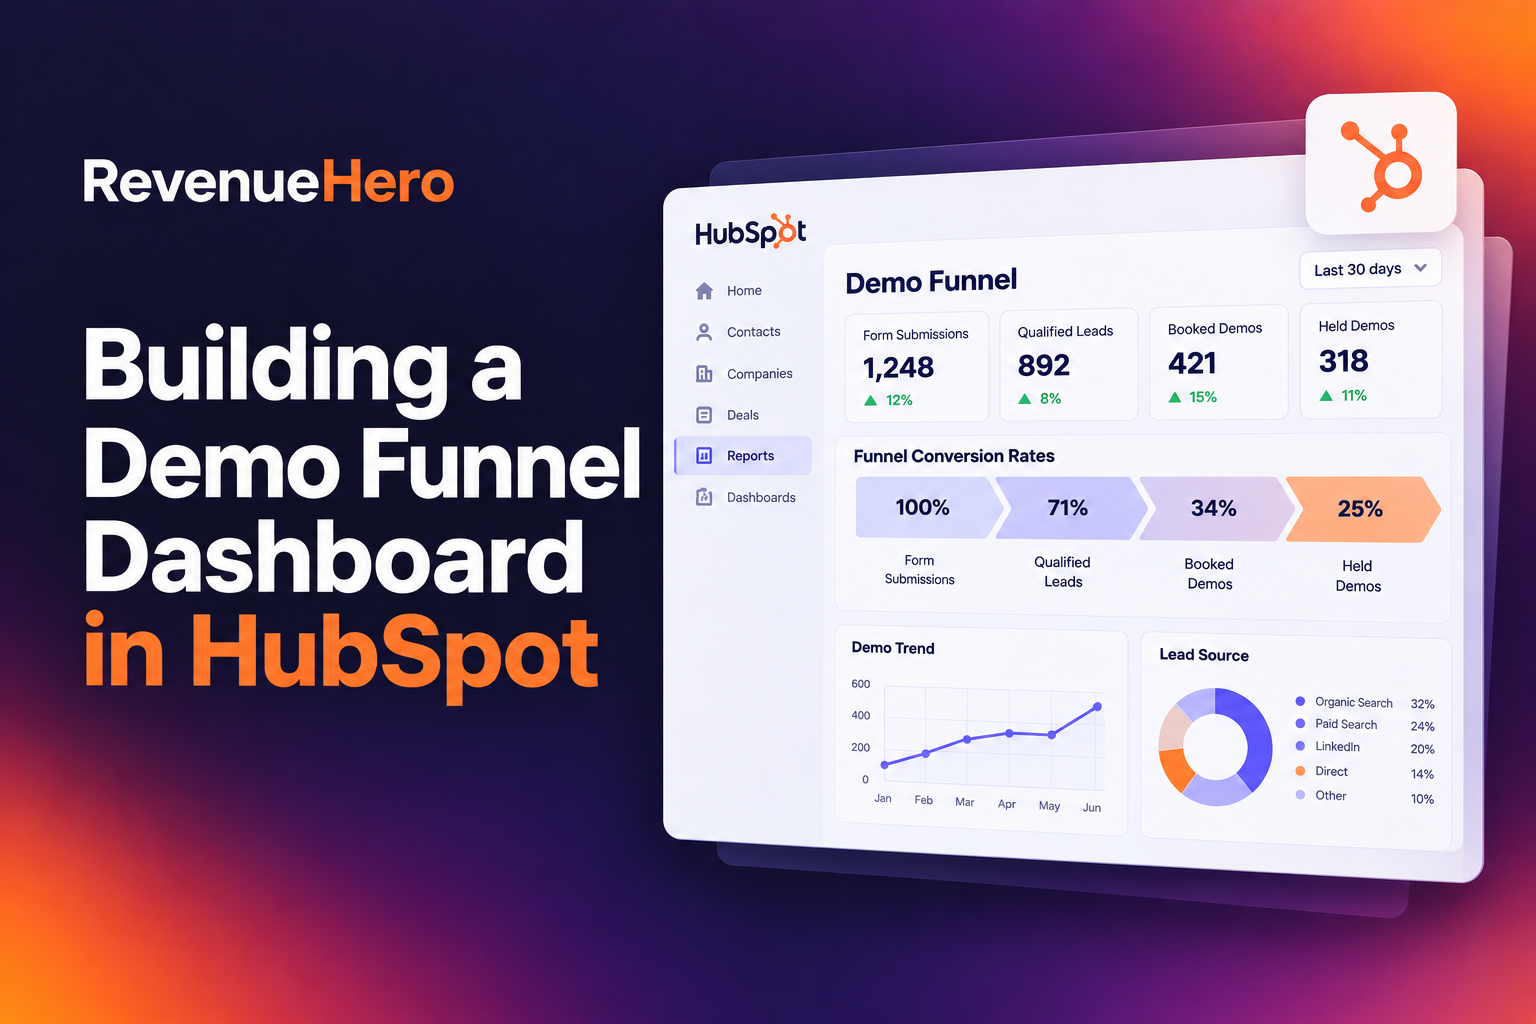
Most B2B SaaS teams already know their demo funnel is leaking. The harder question is where, how fast, and what's actually fixable. A HubSpot dashboard built around demo funnel performance can answer those questions, but only if it tracks the right things. Too many teams build dashboards that report on volume (form fills, MQLs created) without ever surfacing the conversion mechanics that separate a 40% qualified-to-booked rate from a 78% one. Building a demo funnel dashboard in HubSpot isn't about pretty charts. It's about creating operational visibility into the 30 seconds after a form submission: the window where intent either converts or dies. The difference between teams that book 6 out of 10 qualified leads and those that book 8 out of 10 comes down to friction, speed, and routing accuracy. This piece walks through how to structure that dashboard so it actually tells you something useful, grounded in real conversion benchmarks from over a million inbound form fills.
The Decay of Inbound Intent: Why Traditional Funnels Fail
The traditional inbound funnel was designed for a world where buyers waited. A lead filled out a form, an SDR reviewed it within a few hours, maybe sent an email, and eventually a meeting happened. That process assumed patience. In 2026, buyers evaluating multiple solutions simultaneously don't have patience, and their intent starts decaying the moment they hit "submit."
The real problem isn't lead quality or traffic volume. It's the gap between form submission and meeting confirmation. Most teams treat scheduling as an operational afterthought, something that happens downstream. Top-performing teams treat it as the conversion event itself.
The 30-Second Window Between Submission and Meeting
Data from over a million B2B SaaS form submissions shows that the gap between a 35% conversion rate and a 78% rate is determined by what happens in the first 30 seconds after the form fill. Does the prospect see a calendar, or do they see a "thanks, we'll be in touch" message?
Intent probability drops from roughly 80% in the first minute to around 40% by the next day. Every hour of delay compounds the loss. If your funnel routes leads into a manual review queue before scheduling, you're burning intent that your marketing team already paid to generate.
Permission vs. Commitment Language in Conversion Barriers
Among top-performing teams, 29% use "Book a Demo" as their primary CTA, 21% use "Get a Demo," and only 12% use "Request a Demo." The pattern is consistent: commitment language outperforms permission language.
"Request" implies uncertainty. It tells the visitor they're asking for something that may or may not happen. "Book" tells them they're doing something right now. This distinction sounds minor, but it changes the mental model from "considering" to "acting." Search your site for every instance of "Request," "Submit," or "Contact Sales" and replace them with commitment-oriented phrasing. It's a five-minute fix with measurable conversion impact.
Defining Your Core Demo Funnel Benchmarks
Before you build anything in HubSpot, you need to know what good looks like. A dashboard without benchmarks is just a collection of numbers. The benchmarks you choose will determine whether your team treats a 55% qualified-to-booked rate as acceptable or as a problem worth solving.
Your dashboard should answer three questions at a glance: How many qualified leads are we booking? How does that compare to where we should be? And what's changing over time?
Qualified-to-Booked Rates: From Median (62%) to Elite (78%+)
The median qualified-to-booked rate across B2B SaaS companies is 62%. The top 10% hit 78% or higher. The best performer in the dataset books 88% of qualified leads. If your team is converting at 40% and assuming that's normal, it isn't. You're leaving significant pipeline on the table.
At 58% or below, you're in the bottom quartile. At 76% and above, you're outperforming most peers. These aren't theoretical numbers: they're aggregate data weighted by volume across a full calendar year. Your HubSpot dashboard should surface this rate prominently, broken down by source and segment.
Analyzing Seasonal Trends and Monthly Meeting Rate Fluctuations
Q2 is consistently the best quarter for inbound conversion, with April, May, and June all exceeding 60%. Q3 drags, driven almost entirely by August (53.4%) and September (53.7%), though July holds strong at 61.1%. Q4 recovers to around 58%.
Your dashboard should include a monthly trend line for meeting rates so you can distinguish between seasonal patterns and actual funnel problems. If your August numbers drop, that's consistent with the broader market. If your April numbers drop, something is broken. Plan your biggest inbound pushes for Q2 and use Q3 dips as a window for funnel experimentation.
Configuring HubSpot Properties for Accurate Funnel Tracking
HubSpot's default lifecycle stages and deal properties won't give you the granularity you need. You'll need custom properties that capture the distinction between different booking types, disqualification reasons, and qualification outcomes. Without these, your dashboard will tell you how many meetings happened but not why some didn't.
Create a custom contact property for "Booking Type" and another for "Disqualification Reason." These two fields alone will unlock the most important reports in your funnel dashboard.
Differentiating Between 'Request' and 'Instant' Bookings
Not all booked meetings are created equal. A lead who books instantly on the confirmation page converts at a fundamentally different rate than one who receives a follow-up email with a scheduling link three hours later. Your HubSpot properties should distinguish between these paths.
Create a dropdown property with values like "Instant Book," "Follow-Up Book," and "SDR Outbound Book." Populate it through workflow automation based on the time delta between form submission and meeting creation. This single property will reveal how much pipeline you're losing to delayed scheduling.
Tracking Disqualification (DQ) Rates and Intent Signals
Companies with higher DQ rates often have better meeting outcomes. That sounds counterintuitive, but selectivity pays off. If your DQ rate is under 20% and your meeting rate is struggling, you might be letting through leads that waste rep time.
Build a custom property for DQ reason with values tied to your actual qualification criteria: company size, industry mismatch, use case fit. Review these quarterly. If you're selling enterprise deals where a single bad meeting costs hours of expensive rep time, a higher DQ rate makes sense. If you're running a high-velocity SMB motion, you can afford to be more inclusive.
Building the Dashboard: Key Reports for Demo Performance
With the right properties configured, your HubSpot dashboard for demo funnel performance should include five to seven reports, not twenty. Dashboards that try to show everything end up showing nothing. Focus on the reports that drive decisions.
The core reports are: qualified-to-booked rate (overall and by segment), form-to-calendar conversion by source, meeting show rate, and pipeline velocity from booked meeting to opportunity creation.
Form-to-Calendar Conversion by Source and Industry
Build a report that breaks down your form-to-calendar conversion rate by original source (organic, paid, referral, direct) and by industry if you capture firmographic data. Vertical positioning consistently outperforms horizontal messaging: Construction Tech converts at 69.1%, Ecommerce at 68.8%, and Travel Tech at 68.3%, while generic Sales Tech sits at 62.8%.
This report will show you where your best leads come from and which segments convert most efficiently. If one industry converts 10 points higher than another, that's a signal to build dedicated landing pages with industry-specific messaging, logos, and form fields.
Visualizing Meeting Show Rates and Pipeline Velocity
A booked meeting that doesn't happen is worse than no meeting at all: it consumed rep time in preparation and calendar space that could have gone to someone else. Your dashboard should track show rates by source and by booking type (instant vs. delayed).
Pipeline velocity from meeting to opportunity creation is the other critical metric. If meetings are happening but opportunities aren't being created for days afterward, you have a downstream process problem that no amount of funnel work will fix. Use HubSpot's deal stage duration reports to surface this.
Optimizing the Funnel Based on Dashboard Insights
A dashboard that doesn't change behavior is decoration. Once your reports are live, establish a weekly review cadence where someone on the RevOps or demand gen team looks at three numbers: qualified-to-booked rate, show rate, and DQ rate. Changes in any of these should trigger specific actions.
The best-performing teams don't just monitor: they run structured experiments based on what the dashboard reveals.
Replacing Friction with Instant Qualification Rules
If your dashboard shows a gap between form submissions and booked meetings, the first place to look is the qualification-to-booking handoff. Are leads sitting in a manual review queue? Are SDRs emailing scheduling links hours after submission?
Replace manual review with real-time qualification rules that use form responses and enrichment data to determine fit instantly. Tools like RevenueHero let you qualify, route, and present a calendar in the same interaction, eliminating the delay where most intent decay happens. The top 10% of performers in the benchmark data made this shift: they stopped treating scheduling as a downstream task and started treating it as part of the conversion event.
A/B Testing Commitment Phrases and Field Counts
Your dashboard will show you conversion rates, but you need experiments to improve them. Run A/B tests on CTA language: "Book a Demo" vs. "Schedule a Call" vs. "See It in Action." Track each variant as a separate form or use HubSpot's A/B testing on landing pages.
On form fields, the data is clear: top performers convert at 77% with 2 fields and at 76% with 13 fields. The number of fields doesn't matter. What matters is whether each field serves routing, qualification, or personalization. If a field doesn't change who gets the lead or how the rep opens the call, it's costing you conversions without delivering value. Audit every field against that standard.
Scaling Inbound with Automated Routing and Scheduling
Once your dashboard is surfacing clean data and your qualification rules are tightened, the next constraint becomes routing. As inbound volume grows, manual assignment breaks down. Leads get routed to the wrong rep, or they sit unassigned while someone figures out territory ownership or account history.
Automated routing that respects CRM relationships, territory rules, and rep availability is what separates teams that scale their inbound motion from teams that plateau. Your HubSpot dashboard should include a report on routing accuracy: what percentage of meetings land with the correct rep on the first try? If that number is below 90%, you're creating friction that shows up as lower show rates and longer sales cycles.
The companies that consistently book 78% or more of their qualified leads aren't doing anything complicated. They use commitment language. They cut form fields that don't serve routing or personalization. They're selective about who gets through to sales. And when someone qualifies, they put a calendar in front of them immediately. Not tomorrow. Not after an SDR reviews the lead. Right then. Your HubSpot dashboard should make it obvious whether you're doing those things, and if you're not, exactly where the breakdown is happening. Start with the qualified-to-booked rate. If you're at 40% today and you get to 62%, that's 22 more meetings for every 100 qualified leads on the same traffic and the same spend. Get to 78%, and you've nearly doubled your pipeline without touching your ad budget.
Let RevenueHero help your team turn high-intent users into booked meeting without slowing down your funnel.