Most B2B teams measure what happens before the form fill: traffic, impressions, click-through rates. Fewer pay attention to what happens after. That's where pipeline actually gets made or lost.
The gap between a qualified lead and a booked meeting represents one of the most overlooked conversion points in the funnel. A 2025 analysis of over one million inbound form submissions from RevenueHero customers reveals that top performers convert 78% or more of qualified leads into booked meetings. The median sits at 62%. If your team hovers around 35-40% and assumes that's normal, the data suggests otherwise. You're leaving significant pipeline on the table, and the difference often comes down to what happens in the thirty seconds after someone clicks submit.
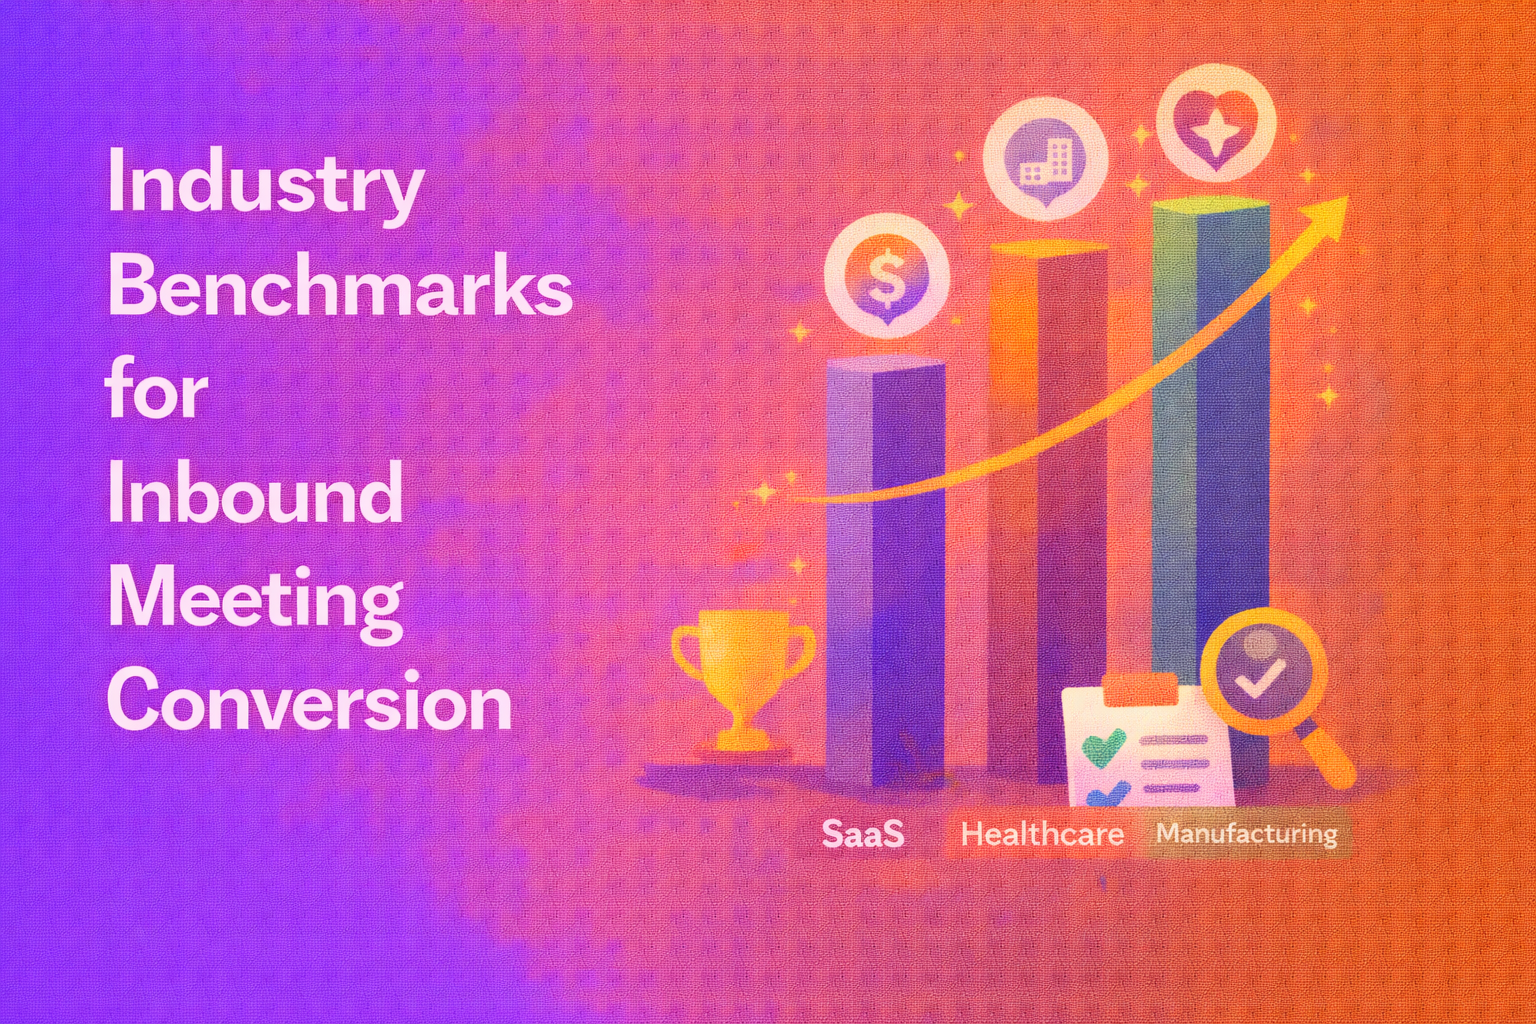
Understanding industry benchmarks for inbound meeting conversion isn't about chasing vanity metrics. It's about diagnosing where your funnel breaks and identifying what good actually looks like for your segment. The benchmarks that follow are drawn from real conversion data across B2B SaaS companies, weighted by volume, across a full calendar year.
Defining Inbound Meeting Conversion Metrics
Before comparing your numbers to benchmarks, you need clarity on what you're measuring. Conversion rates mean different things depending on where you draw the line.
Lead-to-Meeting Request Rates
This metric captures the percentage of total form submissions that result in a meeting request. It includes both qualified and disqualified leads in the denominator. A low rate here might signal poor traffic quality, misaligned messaging, or overly aggressive disqualification criteria. If your disqualification rate sits below 20% but your meeting rate struggles, you might be letting through leads that waste rep time. Tightening criteria on company size, industry, or use case fit can help. Review and update these filters quarterly.
Meeting Request-to-Held Ratios
Not every booked meeting happens. No-shows, cancellations, and reschedules erode your pipeline between booking and actual conversation. Top performers treat this ratio as a distinct optimization target. If you're booking meetings but seeing 25-30% drop off before they occur, the problem isn't lead quality. It's what happens between the booking confirmation and the calendar event.
B2B Industry Benchmarks by Sector
Conversion expectations vary significantly by industry. A 60% qualified-to-booked rate might be excellent in one sector and below average in another.
SaaS and Software-as-a-Service Standards
Across the dataset, generic Sales Tech converts at 62.8% median. Dev Tools sits lower at 55%. MarTech and HR Tech cluster around 62%. The pattern that emerges: vertical SaaS consistently outperforms horizontal SaaS. Companies selling to a specific industry, like Construction Tech at 69.1% or Ecommerce at 68.8%, see higher conversion rates than those with broader positioning. Vertical focus reduces friction because messaging, qualification, and sales conversations align more tightly with buyer expectations.
Professional Services and Consulting
IT and Services companies in the dataset convert at 66% median, with top performers reaching 77%. Professional services benefit from clearer buyer intent. Someone requesting a consultation typically knows what they need. The challenge shifts to routing and response speed rather than qualification complexity.
Manufacturing and Industrial Benchmarks
Supply Chain and Logistics companies convert at 64% median, with top quartile reaching 79%. Industrial buyers often have longer evaluation cycles, but when they request a meeting, intent is high. The bottleneck typically sits in routing complexity: matching the right technical specialist to the right inquiry.
Impact of Lead Source on Conversion Performance
Where leads originate shapes how they convert. Not all traffic carries equal intent.
Organic Search vs. Paid Advertising
Organic search traffic often converts at higher rates because intent is self-selected. Someone searching for a specific solution has already identified a problem. Paid advertising can drive volume, but conversion rates depend heavily on targeting precision and landing page alignment. The benchmark data shows that top performers don't just optimize for traffic volume. They optimize the post-form experience for their highest-intent sources first.
Content Downloads vs. Direct 'Demo' Requests
Direct demo requests convert significantly better than content downloads. The intent gap is obvious: someone downloading an ebook might be researching casually, while someone clicking "Book a Demo" has moved past education into evaluation. Top performers in the dataset use commitment language over permission language. Among high converters, 29% use "Book a Demo," 21% use "Get a Demo," and only 12% use "Request a Demo." The pattern is clear: commitment language outperforms permission language.
Variables Influencing Booking Success Rates
Beyond industry and lead source, operational variables determine whether qualified leads become booked meetings.
Speed to Lead and Response Time Latency
The old benchmark of 35% qualified-to-booked came from manual review queues and delayed follow-up. Someone fills out a form, it goes to a queue, someone manually reviews it, maybe they route it, maybe they email the lead back. Days pass. Intent decays. The meeting that should have happened doesn't.
Companies in the top 10% of the benchmark data made a choice: they stopped treating inbound scheduling as an afterthought and started treating it as a conversion event. The gap between 35% and 78% isn't about having better leads. It's about what happens in the thirty seconds after someone clicks submit. Do they see a calendar, or do they see a "thanks, we'll be in touch" message?
Friction in the Scheduling Experience
Form length matters less than most teams assume. The data shows top performers converting at 77% with two fields and at 76% with thirteen fields. The number doesn't matter. What matters is whether each field does something useful. If a field helps qualification or routing, keep it. If it exists because someone once thought it might be useful, cut it.
The real friction sits after the form. Manual routing, delayed responses, and back-and-forth email scheduling kill conversion. Instant scheduling eliminates that friction entirely.
Strategies for Improving Meeting Show Rates
Booking a meeting is only half the battle. Getting prospects to actually show up requires deliberate effort.
Automated Reminder Sequences
A single confirmation email isn't enough. Top performers use automated reminder sequences that include calendar invites with clear agendas, reminder emails 24 hours and one hour before the meeting, and easy reschedule options for prospects whose calendars shift. The goal isn't to pester prospects. It's to reduce the cognitive load of remembering and prioritizing your meeting among everything else competing for their attention.
Pre-Meeting Qualification and Personalization
Generic meeting invites get ignored. Personalized outreach that references the prospect's specific situation, industry, or stated challenge increases show rates. Some teams send brief prep materials or questions before the meeting. This serves two purposes: it primes the prospect for a productive conversation, and it creates a small commitment that makes no-showing feel more awkward.
Measuring Long-Term ROI of Inbound Meetings
Conversion benchmarks matter, but they're means to an end. The real question is whether your inbound meetings generate revenue efficiently.
Track the full path from form fill to closed-won. Measure not just meeting rates but pipeline generated per meeting, win rates by lead source, and average deal size. Some teams discover their highest-converting lead sources produce smaller deals, while lower-converting sources yield larger opportunities. Optimizing purely for meeting volume can mask these dynamics.
RevenueHero customers who sync meeting data back to their CRM gain visibility into these patterns. Automatic logging eliminates manual work and gives RevOps teams real-time pipeline accuracy. Without that visibility, you're optimizing in the dark.
Quarterly reviews should examine whether your benchmarks are improving and whether those improvements translate to revenue. A 10% increase in qualified-to-booked rate means nothing if those additional meetings don't close. Conversely, a slight dip in meeting rate might be acceptable if you've tightened qualification and improved downstream conversion.
The companies that consistently outperform don't treat inbound conversion as a set-and-forget metric. They treat it as an ongoing operational discipline: measuring, diagnosing, and iterating on what happens between form fill and meeting. The thirty seconds after someone raises their hand determines whether your demand generation investment pays off or leaks away.
Let RevenueHero help your team turn high-intent users into booked meeting without slowing down your funnel.