Most B2B SaaS teams measure success by form submissions. The form gets filled, the lead enters the CRM, and marketing celebrates another conversion. But here's the uncomfortable truth: a form submission isn't a conversion. It's a handoff point where most of your pipeline quietly disappears.
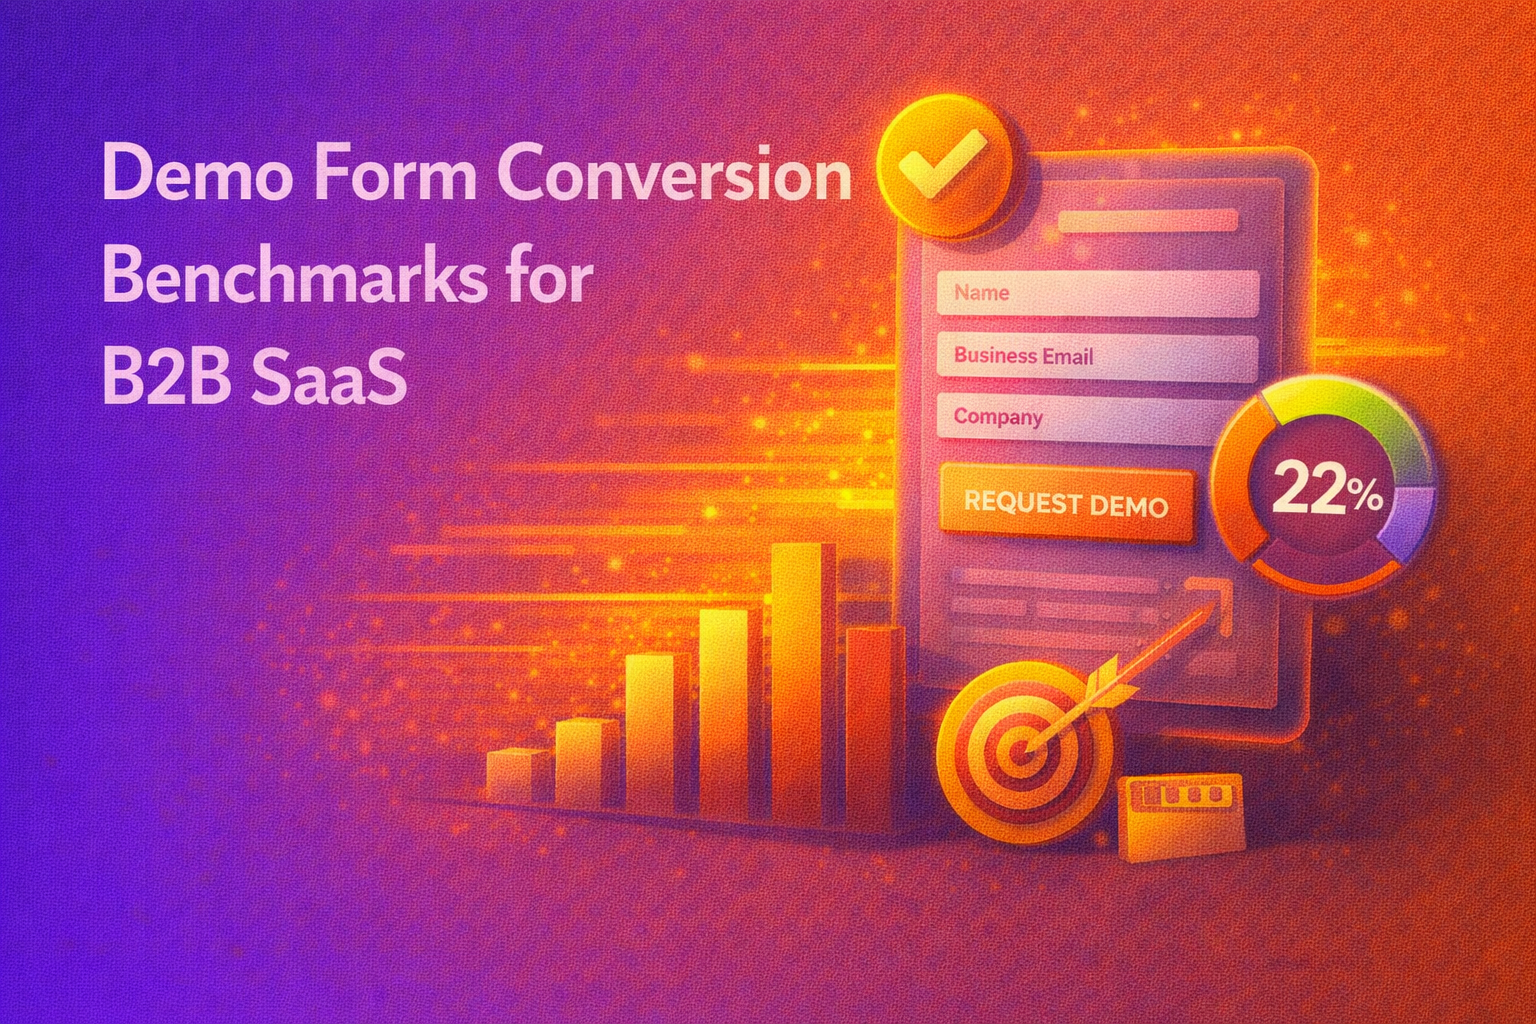
The real conversion happens when a qualified prospect actually books a meeting with sales. And the gap between those two events is where companies lose 40% to 60% of their inbound demand. Demo form conversion benchmarks for B2B SaaS reveal a stark reality: the median qualified-to-booked rate across companies sits at 62%, while top performers hit 78% or higher. The best in class reach 88%. That 26-point spread represents the difference between a struggling pipeline and a thriving one, often with identical traffic and spend.
The companies closing this gap aren't running better ads or writing better copy. They're fixing what happens in the 30 seconds after someone submits a form. Manual review queues, delayed follow-up, and friction-heavy processes kill intent before sales ever gets involved. Understanding where your demo conversion rates actually stand, and what's dragging them down, is the first step toward capturing the pipeline you're already paying for.
Defining the Standard: What is a Good Demo Conversion Rate?
The question "what's a good conversion rate?" gets asked constantly, but the answer depends entirely on what you're measuring. Most benchmarks conflate visitor-to-submission rates with qualified-to-booked rates, creating confusion that leads teams to optimize the wrong metrics.
A useful benchmark focuses on qualified-to-booked conversion: the percentage of leads who pass your qualification criteria and actually schedule a meeting. Based on analysis of over one million inbound form submissions from B2B SaaS companies, the median sits at 62%. The top 10% of performers convert at 78% or higher, and the absolute best reach 88%.
If your team is converting at 30% to 40% and assuming that's normal, the data says otherwise. You're leaving significant pipeline on the table, and the fix isn't more traffic.
Average Conversion Benchmarks by ACV and Deal Size
Conversion rates vary significantly based on your average contract value and target market segment. Enterprise-focused companies booking larger deals see different patterns than SMB-focused teams running high-velocity motions.
SMB-focused companies show a 63.2% average meeting rate with a 21.8% disqualification rate. Mid-market companies perform at 61.2% with a 28.1% disqualification rate. Enterprise teams, interestingly, hit 70.1% meeting rates despite a much higher 71.2% disqualification rate.
The enterprise pattern reveals something counterintuitive: being selective about who gets through to sales actually improves conversion. When reps aren't wasting time on poor fits, the leads who do make it through are more engaged and more likely to show up. Higher disqualification doesn't hurt your pipeline when it's filtering out genuinely poor fits rather than adding arbitrary friction.
Traffic Source Disparity: Paid vs. Organic Performance
Where your traffic originates significantly impacts conversion potential. Organic visitors who find you through search or direct navigation typically arrive with clearer intent and higher qualification rates than paid traffic.
Vertical SaaS consistently outperforms horizontal SaaS across traffic sources. Construction tech leads at 69.1%, ecommerce at 68.8%, and travel tech at 68.3%. Generic sales tech sits at 62.8%. The pattern holds: specific positioning for defined audiences converts better than broad messaging trying to capture everyone.
Seasonal patterns also matter. Q2 represents peak performance with a 61.0% average, while Q3 drags down to 55.9%, driven almost entirely by August at 53.4% and September at 53.7%. Planning your biggest inbound pushes for April through June aligns with when prospects are most responsive.
Critical Factors Influencing Demo Form Completion
The form itself is where most conversion conversations start, but it's rarely where the biggest problems live. Teams obsess over field counts while ignoring the experience that follows submission.
Impact of Form Length and Field Requirements
The conventional wisdom says fewer fields mean higher conversion. The data tells a more nuanced story.
Top performers convert at 77% with 2 fields and at 76% with 13 fields. The number doesn't determine success. What matters is whether each field serves a clear purpose. A 13-field form works brilliantly when each field changes who gets the lead or how the rep opens the call. A 2-field form works when your ICP is broad and any additional friction would cost more than the data provides.
The question to ask isn't "how many fields?" but "what does each field enable?" If a field doesn't influence routing, qualification, or conversation quality, it's costing you conversions without delivering value. Medical software buyers expect detailed intake. Consumer-facing SaaS buyers don't. Match your form complexity to your audience's expectations and your actual data needs.
The Role of Social Proof and Trust Signals
Social proof placement and specificity directly impact form completion rates. Generic testimonials do little. Specific results create confidence.
A testimonial stating "saw a 57% increase in bookings within 90 days" gives prospects a concrete expectation. It also implies you have customers willing to share real numbers, which is its own form of credibility. One testimonial with a specific metric outperforms ten without.
If you're going to invest in social proof, invest in getting specific numbers from your best customers. Call them this week. Ask for one sentence with a metric. Put the best one on your demo page, above the fold, near the form.
Optimizing the Post-Submission Experience
The 30 seconds after form submission determine whether your qualified lead becomes a booked meeting or a decaying contact record. This is where most pipeline actually dies.
Direct Scheduling vs. Standard Thank You Pages
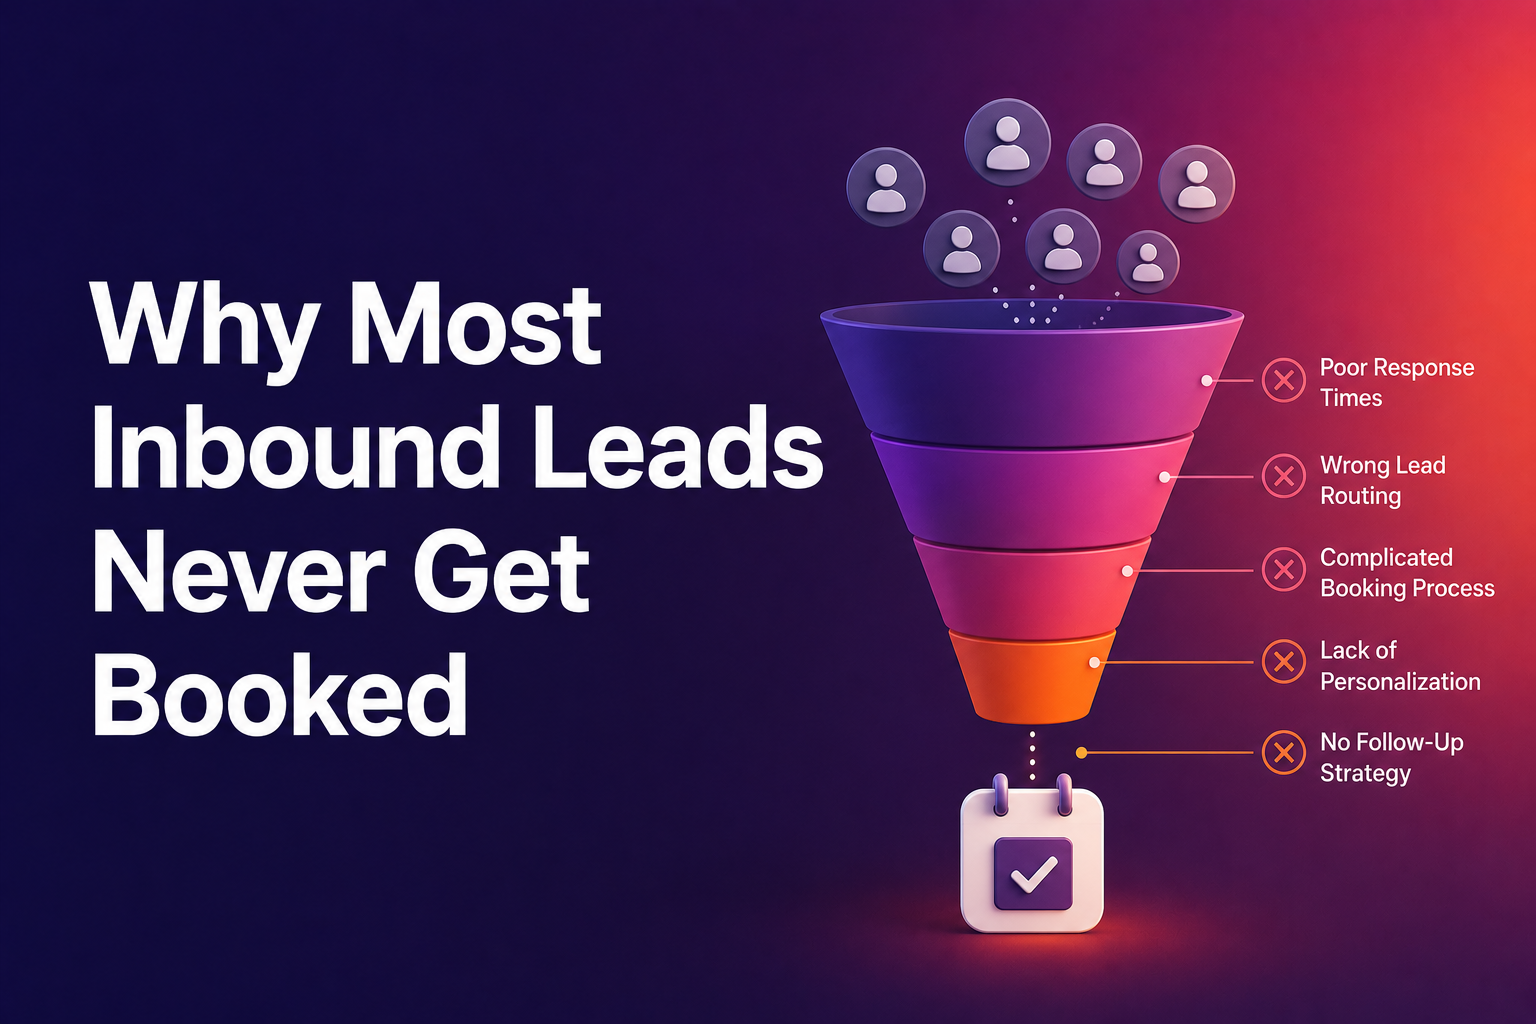
The old model sends prospects to a thank you page promising "we'll be in touch." Then an SDR reviews the lead, maybe within hours, maybe within days. By the time someone reaches out, the prospect has moved on, gotten distracted, or booked with a competitor who responded faster.
Top performers eliminate this gap entirely. The form submission triggers instant qualification, and qualified prospects immediately see a calendar to book time. No waiting for review. No lag while intent decays. The qualified-to-booked handoff shrinks to seconds.
Among top performers, 29% use "Book a Demo" as their CTA, 21% use "Get a Demo," and only 12% use "Request a Demo." Commitment language outperforms permission language. Search your site for every instance of "Request," "Submit," or "Contact Sales" and replace with "Book" or "Schedule."
Speed-to-Lead: Benchmarking Response Times
The old benchmark of 35% qualified-to-booked came from manual review queues and delayed follow-up. Companies proving that 60%, 70%, even 80%+ is achievable treat inbound scheduling as their conversion event, not just the form fill.
Response time isn't measured in hours anymore. It's measured in seconds. The companies booking 75% or more of qualified inbounds the same day aren't doing it through faster SDRs. They're automating the handoff entirely, removing the human delay from the qualification-to-scheduling process.
Technical Strategies to Boost Conversion Rates
Process improvements only work when the underlying technology supports them. Two technical investments consistently separate top performers from the rest.
Implementing Data Enrichment to Reduce Friction
Data enrichment lets you ask fewer questions on the form while gathering more information for routing and qualification. A prospect enters their email, and enrichment pulls company size, industry, tech stack, and existing CRM relationships.
This approach serves two purposes. First, it reduces form friction by eliminating fields prospects find tedious. Second, it enables smarter routing based on data prospects couldn't or wouldn't provide themselves. You can route based on territory, product interest, or account match rather than simple round robin.
The best implementations qualify leads using form data, enrichment, and CRM history together. High-value leads route to your best reps. Existing accounts route to their current owners. The routing logic respects relationships while maximizing conversion probability.
Mobile Optimization and Responsive Design Standards
Mobile traffic continues growing, but mobile form completion rates lag desktop significantly when forms aren't optimized. Fields that work fine on desktop become frustrating on mobile. Calendar widgets that display cleanly on large screens become unusable on phones.
Test your entire flow on mobile devices, not just the form appearance. Submit the form. Go through qualification. Attempt to book. Every friction point you encounter costs you conversions from mobile visitors, and mobile visitors increasingly represent your highest-intent traffic.
Measuring Success Beyond the Submission
Form submissions and even booked meetings aren't the final measure of success. The pipeline contribution from your demo forms determines whether your inbound investment actually pays off.
Form-to-Qualified-Meeting Conversion Benchmarks
The full funnel from form submission to qualified meeting held involves multiple drop-off points: disqualification, no-shows, cancellations, and rescheduling failures. Each represents an opportunity for improvement.
Top performers track and optimize each transition separately. They know their disqualification rate and whether it's filtering poor fits or adding friction. They know their no-show rate and whether automated reminders reduce it. They know their reschedule rate and whether providing easy reschedule links recovers otherwise lost meetings.
Automation rules that send reschedule links for canceled meetings and no-shows recover pipeline that would otherwise disappear. These aren't nice-to-haves. They're the difference between capturing and losing meetings you already earned.
Tracking Lead Quality and Pipeline Contribution
Not all booked meetings contribute equally to pipeline. A meeting that converts to opportunity is worth more than one that doesn't. A meeting with a decision-maker is worth more than one with a researcher.
Review your disqualification criteria quarterly. If your DQ rate is under 20% and your meeting rate is struggling, you might be letting through leads that waste rep time. Consider tightening criteria on company size, industry, or use case fit. If your DQ rate is high but meeting quality is strong, your selectivity is working.
The companies that maintain qualification standards while investing in process are the ones who emerge with strong funnels at scale. The goal isn't maximum meetings. It's maximum qualified pipeline from your existing traffic.
Building Your Conversion Baseline
Demo form conversion benchmarks for B2B SaaS provide a target, but your specific baseline matters more than industry averages. Start by measuring your current qualified-to-booked rate accurately. If you're below 62%, you have clear room for improvement. If you're between 62% and 78%, you're performing well but can still close the gap to top performers.
The fixes that move the needle fastest involve what happens after the form, not the form itself. Instant scheduling, intelligent routing, and automated follow-up for no-shows and cancellations compound into significant pipeline gains without requiring more traffic or spend.
Your inbound leads already have intent. The question is whether your process captures that intent or lets it decay. The 30 seconds after form submission determine the answer.
Let RevenueHero help your team turn high-intent users into booked meeting without slowing down your funnel.