


Welcome to the twenty-second edition of Breaking Inbound, your weekly deep-dive into inbound numbers and form-to-demo conversion rates across industries.
Let’s say a new marketer joins your team.
They’re full of energy and want to fix your inbound funnels, one leak at a time.

They do all the math and figure out that your meeting conversion rate is 58%. But wait, the median benchmark is 62%!
Uh-oh, time to cue the pipeline review, the funnel audit, and a 45-minute Zoom call on “how to fix our demo page?”. And it’s only at minute-44 of the meeting that you realize: you’re a developer tools software company. And your industry’s median is 50%.
Which means you’re outperforming by 8%.
So how do you articulate this to your peers, managers, and that feisty new marketer who won’t quit until they see a 1% improvement in your funnel? Read below ⬇️
Your meeting rate benchmark is lying to you 🤯
After that meeting, in case you didn’t hit the realization that you’re comfortably ahead, this is what happens:
- Marketing panics and gets defensive
- RevOps opens up another spreadsheet
- Two weeks later, your demo page is being torn down to be redesigned
The worst part is: nobody checked the industry-wise form-to-demo conversion rate.
We’ve been tracking this data across 22 weeks now, and the cross-industry average meeting conversion rate, i.e., qualified form fill to booked meeting conversion rate is 62.3%.
But if you look closely, this is the mean of two buyer motions that work distinctively.
Two buyer motions, two clusters
High-intent verticals convert at 64–71%, on average. These are industries where the buyer is well-versed with the problem, knows the category, and fills the form with purchase intent.
Healthcare software buyers are solving a specific compliance or workflow problem, whereas fintech buyers have evaluated their category and are ready to talk pricing. Real estate and manufacturing software buyers operate in industries where the decisions are fewer, but more deliberate and urgent. If they’re filling out a demo form, they want a meeting.
Low-friction verticals, on the other hand, convert at 50–62%, on average. These are industries that typically run hybrid PLG + sales-led motions, where the person filling a demo form might still prefer self-serve.
Developer tools has many form fills that come from developers who want to try the product first before talking to a sales rep. Marketing & sales software live in crowded categories where buyers fill multiple demo forms as they comparison-shop. IT & Security often involves a technical evaluator who needs internal buy-in before committing to a call.
The gap is consistent
High-intent verticals have outconverted low-friction verticals across all these 22 weeks of data that we’ve tracked. The gap averages at 9.4%, ranging anywhere between 4% and 17%.
So, if a company is converting at 59% in Healthcare software, it’s underperforming by 11% against its industry average. However, if a company is converting at 59% in developer tools, it’s outperforming by 9%.
What this means for your benchmarking
The cross-industry average of 62% describes the average across all companies and industries. It sits in the gap between two distinct buyer behaviors: high-intent and low-friction. So comparing yourself to the 62% benchmark is like checking your height against the average of basketball players and computer engineers.
Find your industry’s row in the table below. That’s the number that tells you whether you have a conversion problem or a benchmarking problem.
Onto the regular weekly numbers now ⬇️
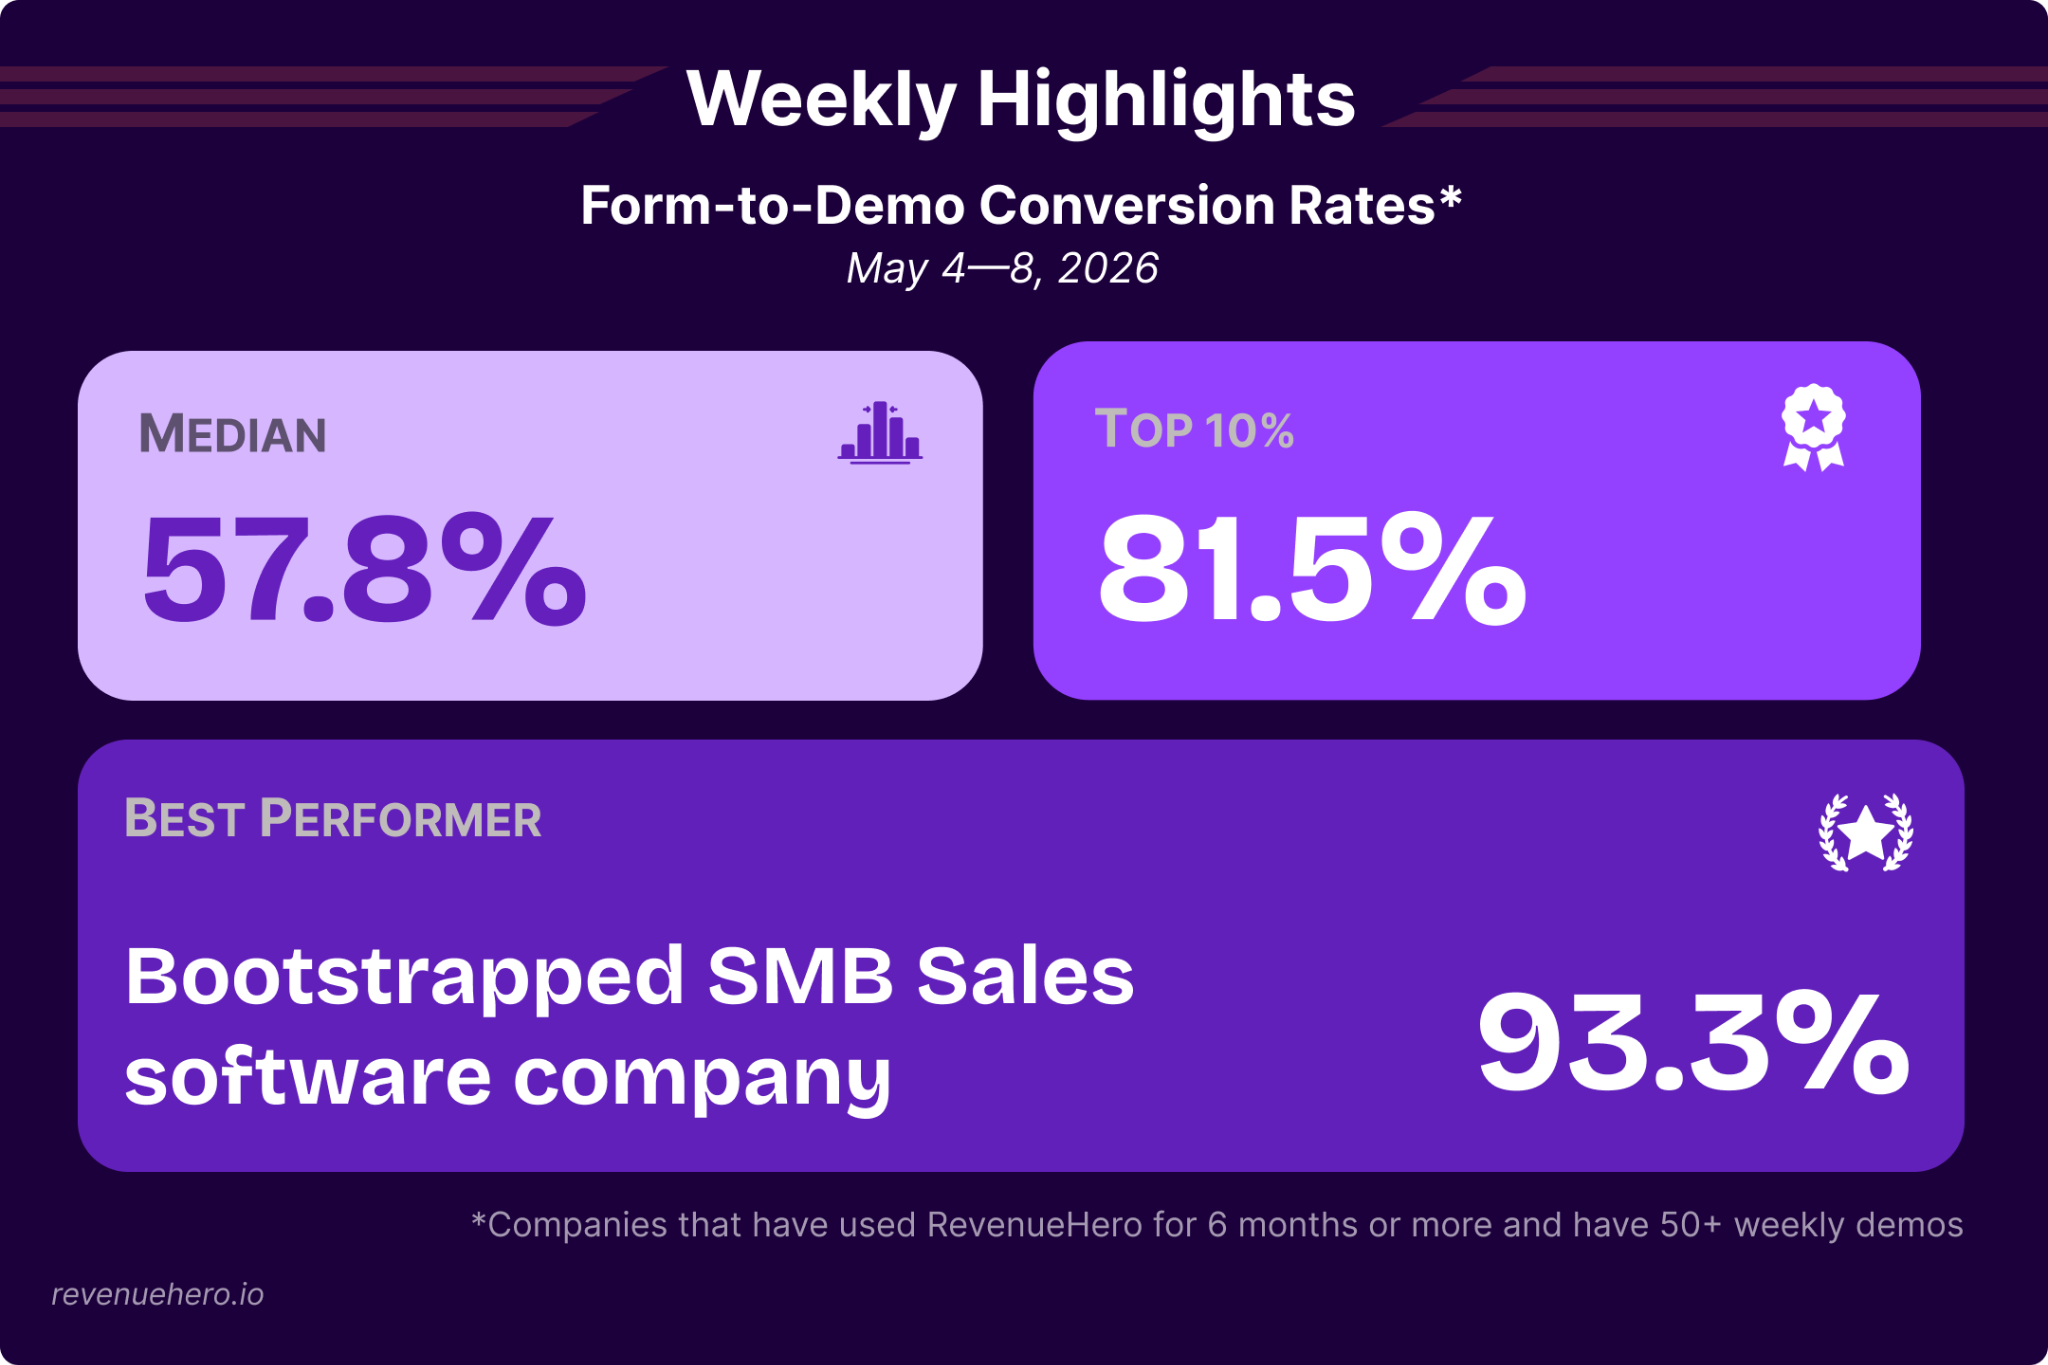
Weekly Highlights ✨
The best performer last week was a bootstrapped SMB sales software company. Here’s what we learnt from their demo page:
- The landing page leads with a single CTA "Get a Demo"
- The page features 24 customer logos in a scrolling carousel and 12+ video testimonials from named buyers.
- They had an 84% DQ rate last week, i.e., the form filters out leads with purchase intent even before showing the calendar.
- Trust signals layer in fast: a 4.8-star app rating badge, mentions of listings per month, etc.
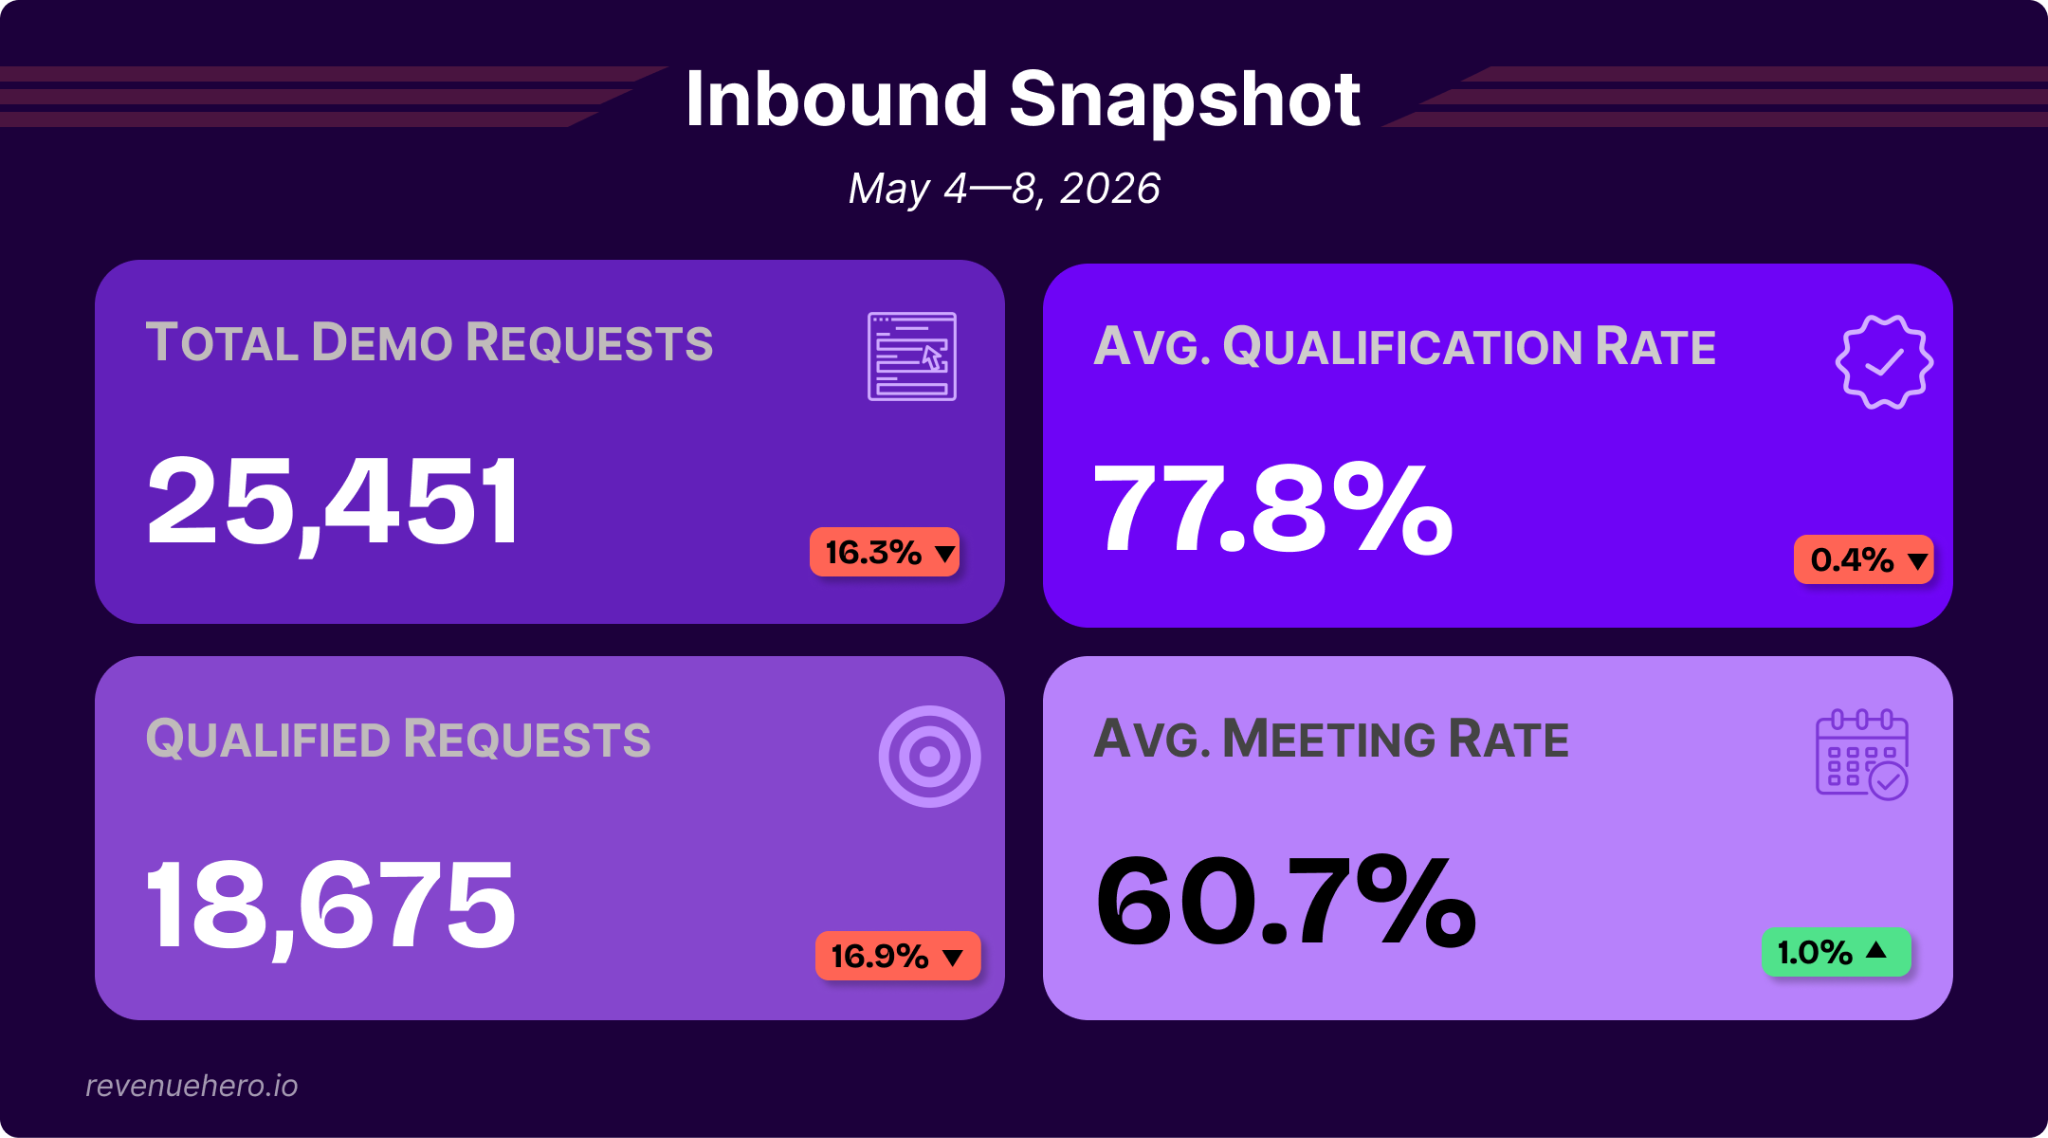
Inbound Snapshot
While volume fell hard last week, efficiency stayed steady. Demo request volumes plunged 16.3%, while qualified requests saw a 16.9% plummet.
Despite the pullback, qualification rates remained steady at 77.8%, while form-to-demo conversion rates saw a 1% improvement over the previous week’s value. Fewer people showed up, but the ones who did converted better.
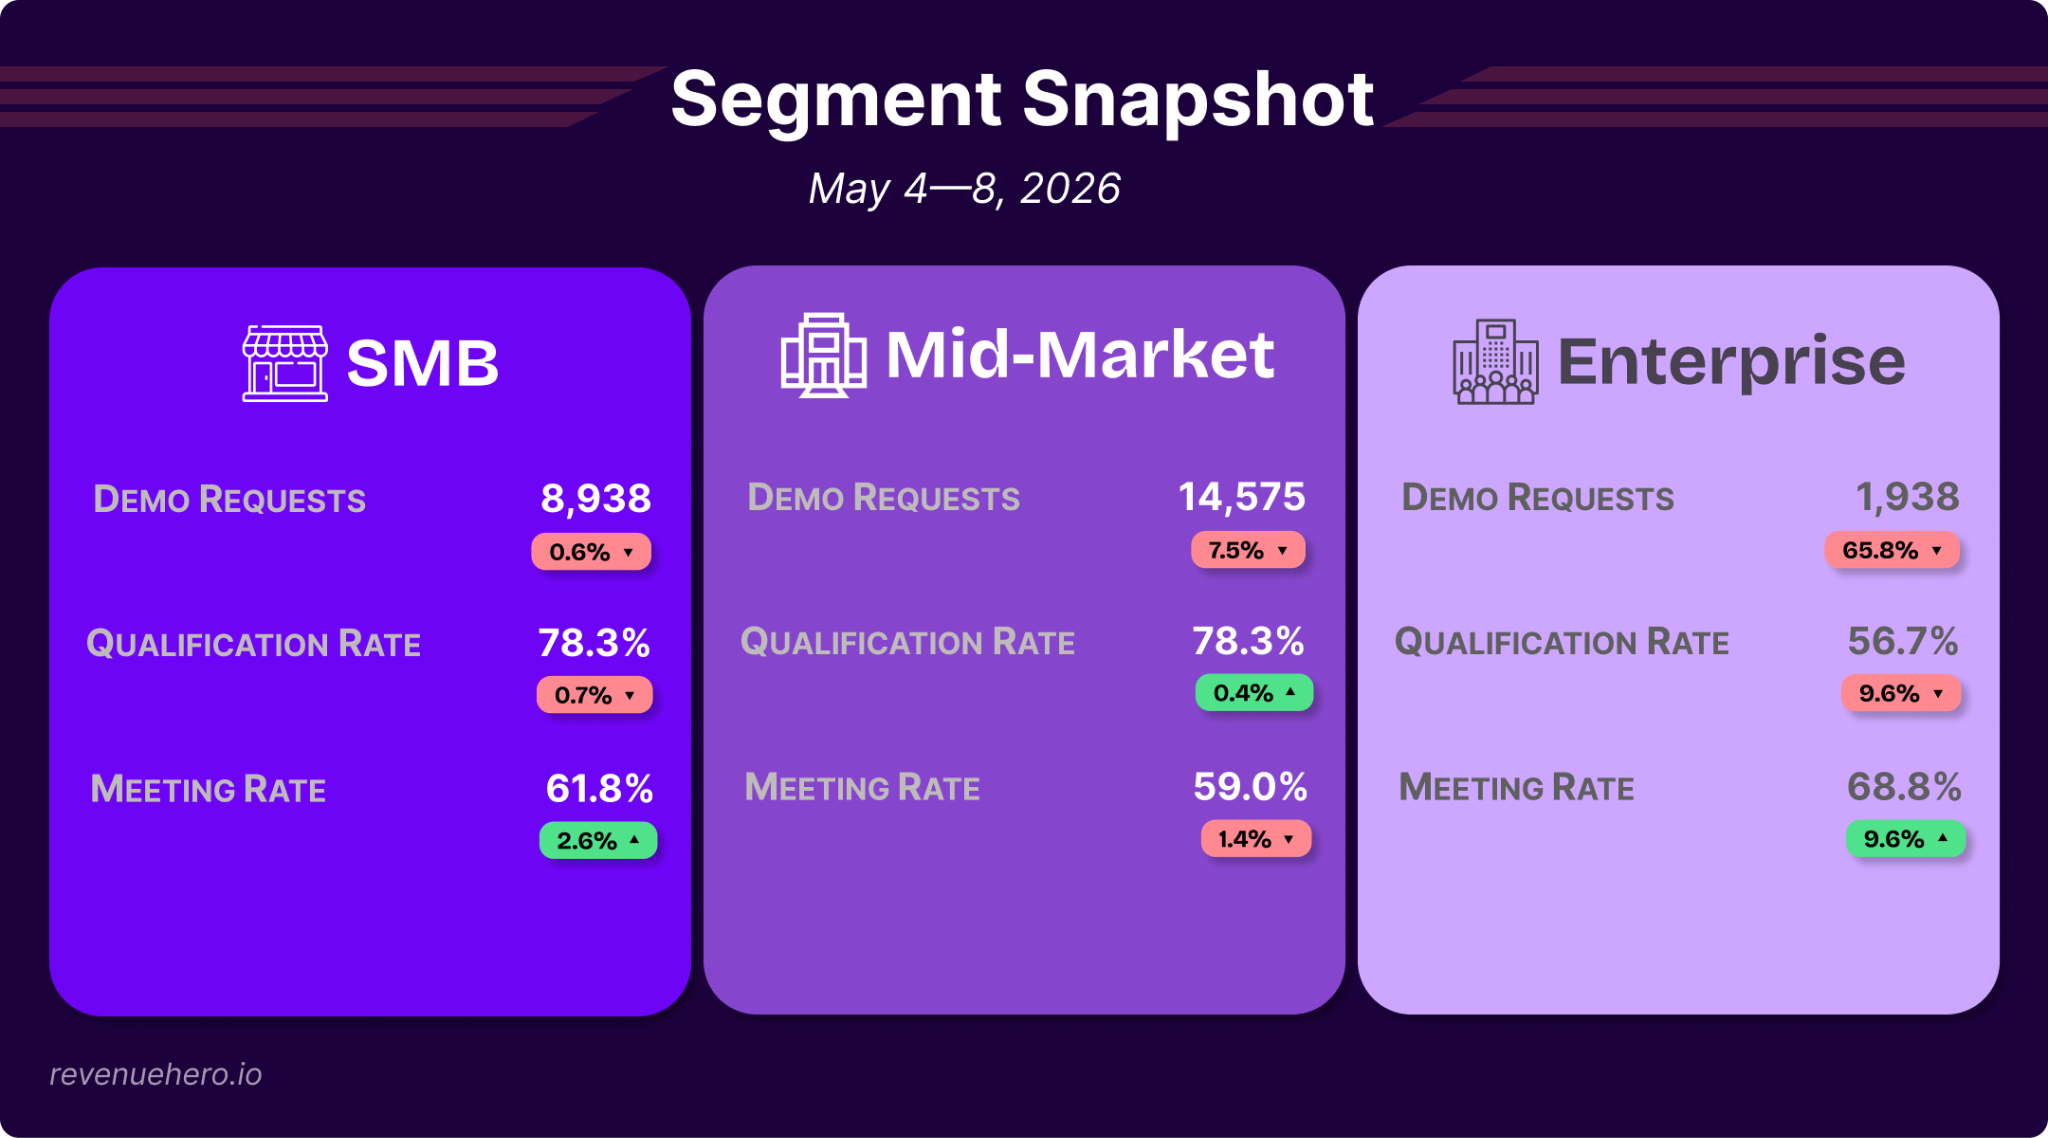
Segment Snapshot
SMB barely flinched as demo request volumes held flat and form-to-demo conversion rates climbed 2.6%. Qualification rates slipped 0.7%.
Mid-market took the hit on both fronts: demo requests dropped 7.5% last week, while meeting conversion rates saw a 1.4% decline. Qualification rates improved marginally, but that didn’t translate to booked meetings. If you’re in the mid-market segment, check what happens between your demo form and your calendar. The routing or scheduling experience may be where the pipeline is leaking.
Enterprise saw a dramatic decrease in demo request volumes (66%) and qualification rates (10%), but their meeting conversion rates soared 9.6%, making it the strongest of all segments last week.
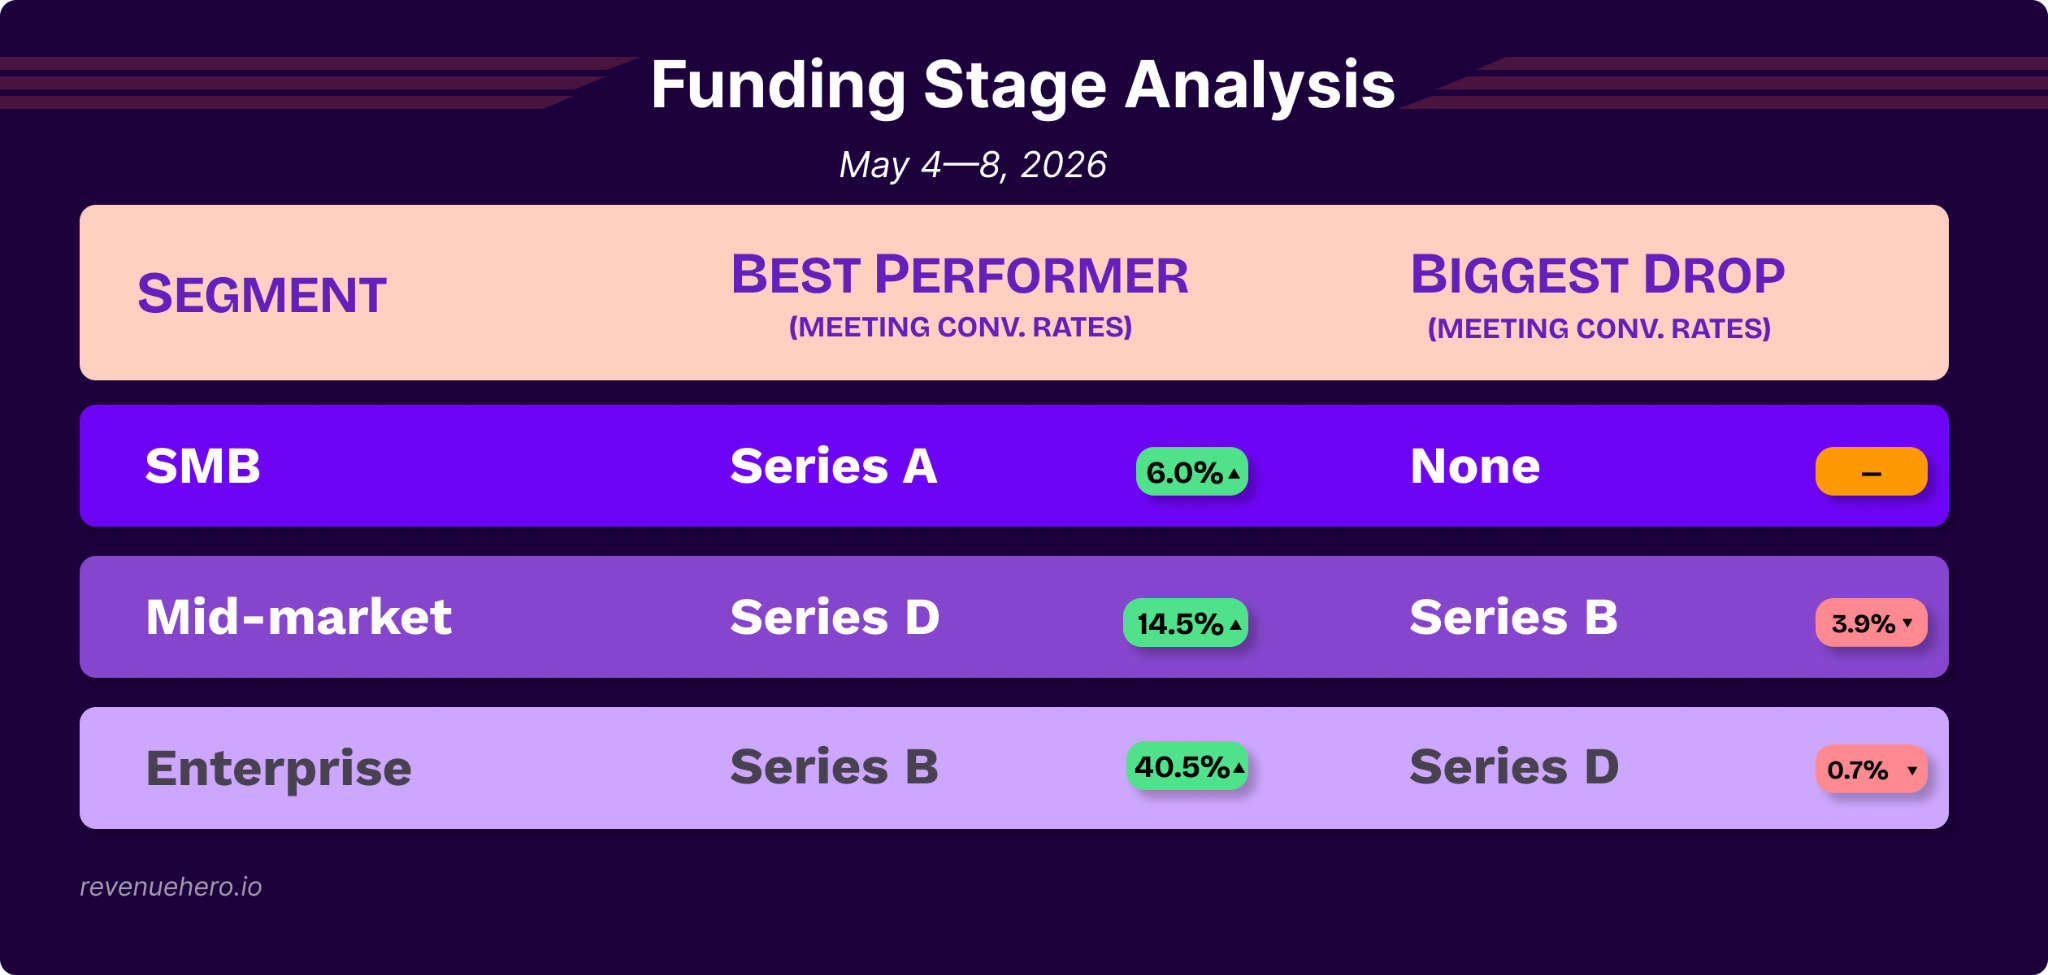
Funding Stage Analysis
Last week was all green for SMB: no funding stage saw a decline in meeting conversion rates. Series A jumped 6%, the biggest mover in the segment, while Series C continued to sit in a league of its own at 80%+. Mid-market Series D companies catapulted 14.5%, while bootstrapped companies saw a 9.2% surge. Series B Enterprise companies saw a 40.5% increase in their meeting conversion rates, with other funding stages holding steady or improving their conversion rates.
On the other end, mid-market Series B softened 3.9%, while mid-market Series A saw a 2.8% decline. If you’re in either of these cohorts, audit your demo page today. Our analysis of the 50 top-performing demo pages is the fastest place for you to get started.
Industry-wise Meeting Rates
IT & Security saw the biggest surge last week, moving up to 61% with a 7.1% increase. Marketing (5.5%) and travel (5.1%) also saw strong gains.
On the other hand, real estate plunged 12.7%, the steepest fall of last week after claiming the throne in the previous week. Legal & compliance software dropped 7.6%, sliding to the bottom of the table.
While all industries converted 50%+ of their qualified inbounds into booked meetings, no industry crossed the 70% mark. 60% of industries witnessed steady or better form-to-demo conversion rates.
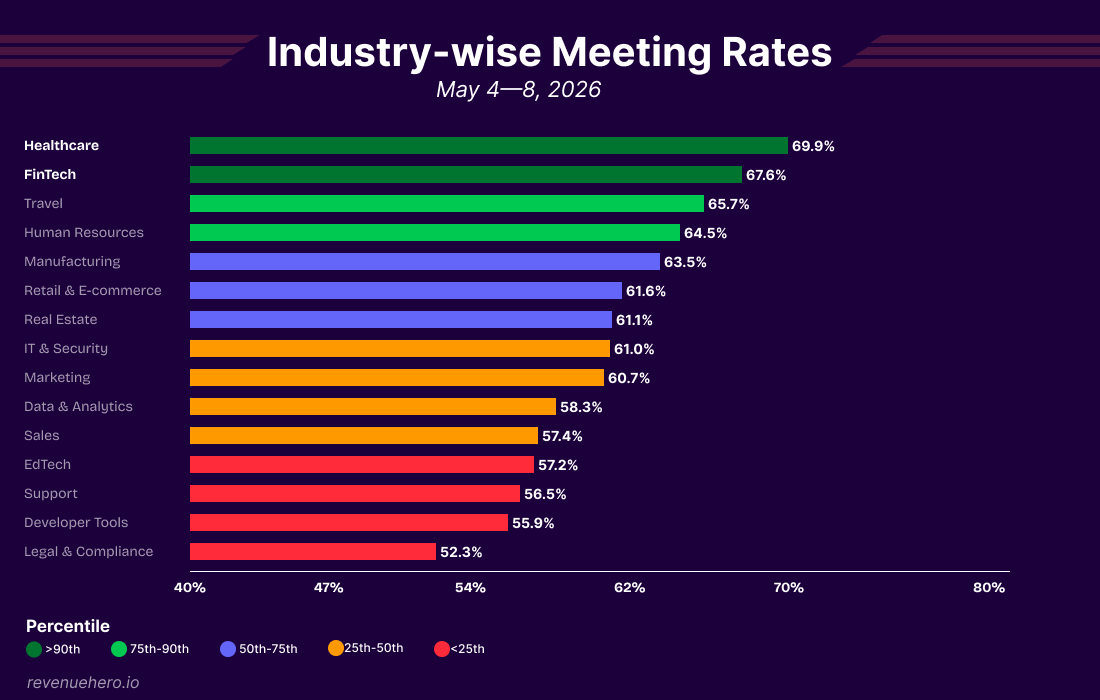
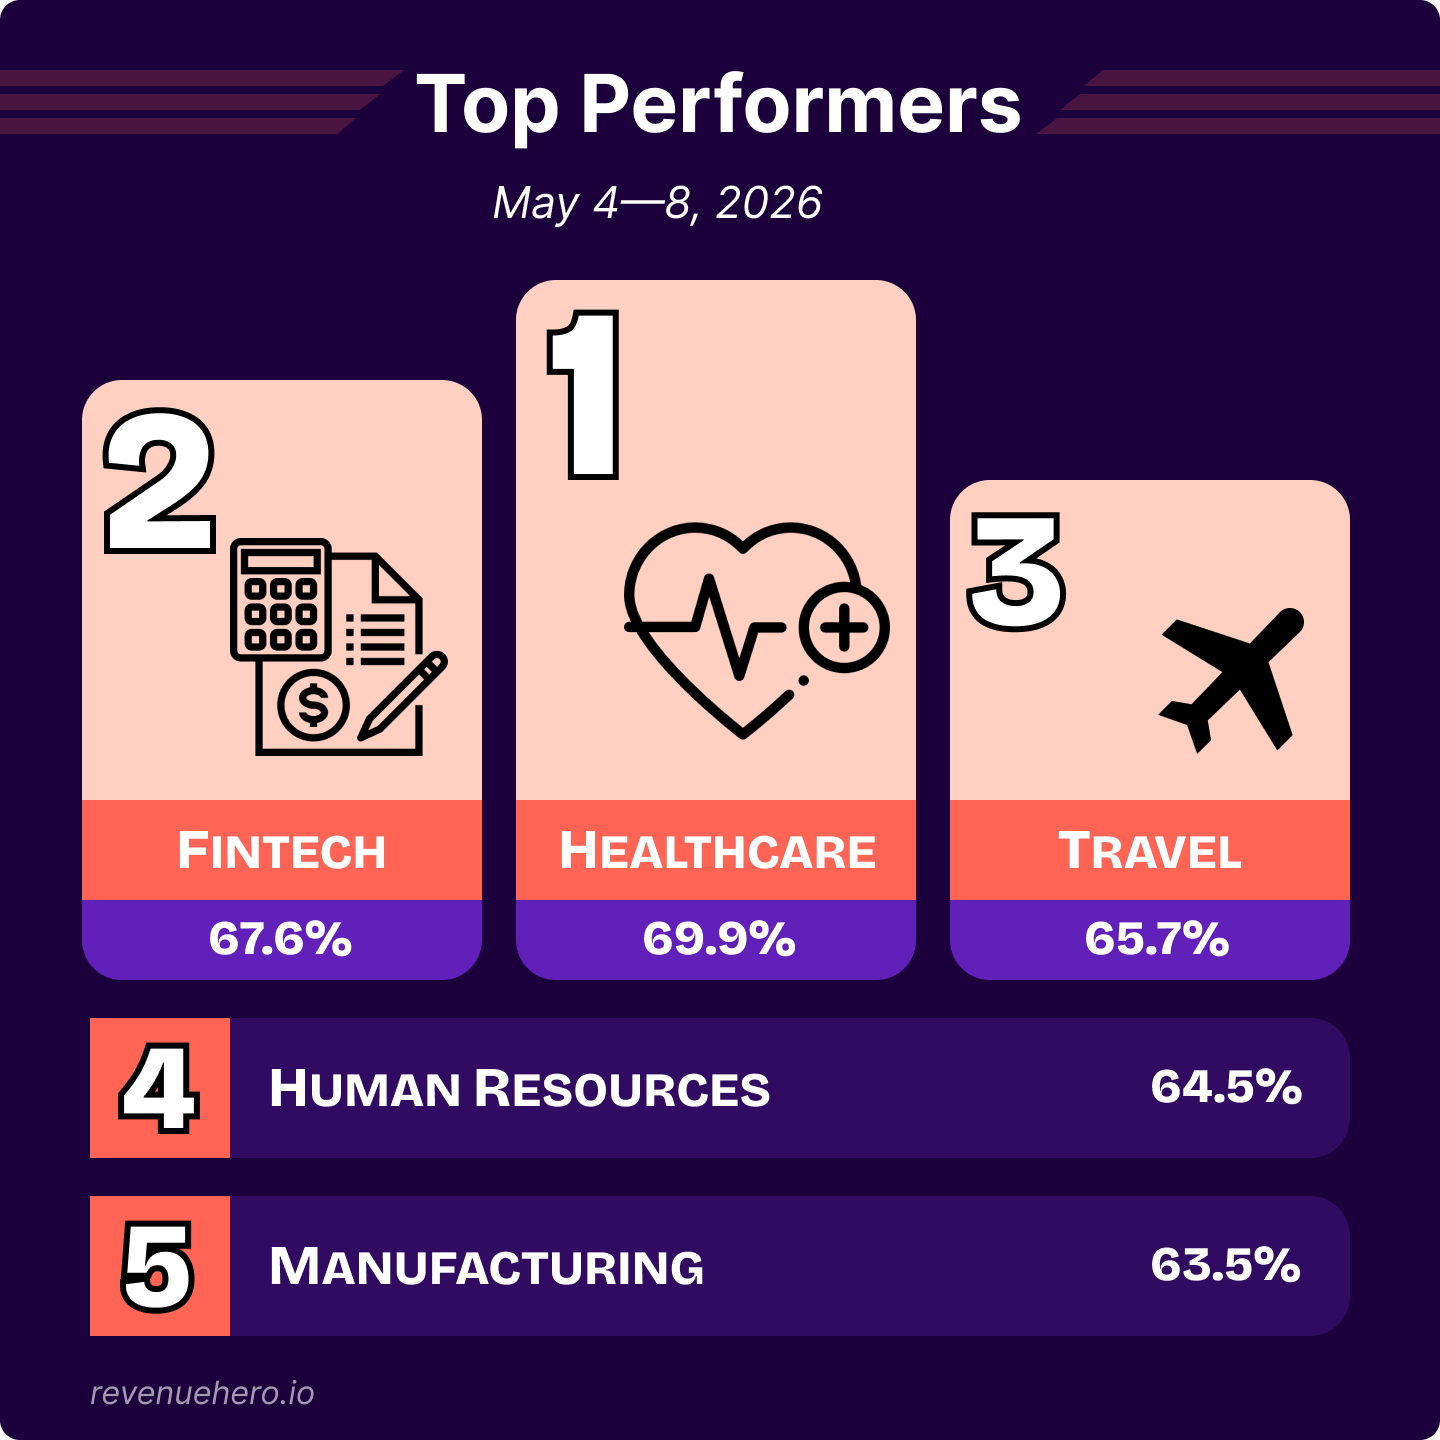
The Leaderboard
Healthcare retained the throne at 69.9%, narrowly edging out FinTech (67.6%). Both sat in the above the 90th percentile last week. Travel completed the podium at 65.7%.
Key Observations
- Volume contracted sharply: Demo requests fell 16.3% across the board, the steepest weekly drop outside holiday weeks, but meeting rates improved 1.0% to 60.7%, suggesting the remaining inbound was higher quality.
- SMB was the steadiest segment, with barely any volume loss (-0.6%) and a good meeting rate improvement (+2.6% to 61.8%).
- Mid-Market is leaking between form and calendar: volume dropped 7.5%, and meeting rates dipped 1.4% to 59.0% despite qualification rates ticking up.
- Enterprise converted at 68.8%: the highest meeting rate of any segment, and on dramatically lower volume (-65.8%). Fewer leads, tighter filter, better output.
- IT & Security posted the biggest industry comeback, surging 7.1% to 61.0% after a rough 53.9% last week. Marketing (+5.5%) and Travel (+5.1%) also bounced back strongly.
- Real Estate had the steepest fall, plunging 12.7% from 73.8% to 61.1%. Legal & Compliance also dropped 7.6% to 52.3%, now the lowest-converting industry.
- Series D Mid-Market catapulted 14.5% to 70.6%, the strongest funding-stage jump outside Enterprise. Series A SMB also jumped 6.0%, while Series B Mid-Market softened 3.9%.
We'll be back next week with a fresh batch ✨
Until then, keep those meetings flowing 📈


