


Welcome to the eighteenth edition of Breaking Inbound, your weekly deep-dive into inbound numbers and form-to-demo conversion rates across industries.
For the first edition of Q2 2026, we went back to the classics: the routing logic.
Our top 10% customers have held 70%+ form-to-demo conversion rates in at least 16 of the last 18 weeks. They continued to turn more handraisers into booked meetings, no matter how their industry was performing.

We analyzed their routing logic, and here are 6 layers that they had in common ⬇️
The 6-layer routing stack fuelling 70% conversions 🚀
Across the last 18 weeks of Breaking Inbound data, our top 10% customers held an average meeting conversion rate of 70%+, while receiving 50+ demo requests each week. A commonality that we observed was none of them relied on round robin alone.
Here are the six layers:
Layer 1: Ownership lookup before round robin
They check the CRM for an existing owner first (company match, then contact match), and only fall back to round robin if no owner exists. A Series E enterprise retail & e-commerce software company takes it one step further with a "stopgap user" that catches leads with sales activity in the last 45 days but no current owner, parking them with a designated rep instead of round-robining them to the wrong AE.
Layer 2: Geography & territory
Geography in a routing stack is a matrix, not one-dimensional. Country is the easy one. Region (APAC vs. NA, EMEA vs. LATAM) forms the next rung, below which sit state, metro, zip code, etc. Overlay industry, account segment and company size and the territory map becomes a grid.
The way our customers map it on RevenueHero is by breaking the logic into four pieces:
- Teams: Grouping reps by the territory they own (NA Enterprise, APAC SMB, EU Mid-Market, etc.)
- Lists: Store the territory definitions as reusable lists. A "California zip codes" list. A "Fortune 500 domains" list. A "Healthcare ICP" list.
- Distribution rules: Filter inbound leads against the lists and route them to the matching team. Rules are stacked in priority order: ownership check first, then geo, then segment, then fallback.
- Inbound router: One router handles every channel the lead can arrive on: the website form, the email campaign link, the in-app CTA, the trade show iPad.
A Series A Mid-Market manufacturing software company uses geo-IP detection at form load: US, Canada, and Australia visitors hit an AE scheduler, everyone else lands in an SDR queue.
Layer 3: Segment & use-case splits
Top-performing companies also route based on company size into SMB, mid-market, and enterprise pods. A Series B mid-market healthcare software company asks "What can we help you with?" on the form and routes to different rep pods, along with redirecting them to separate thank-you pages based on the answer.
Layer 4: DQ at the router
They block free email domains (Gmail, Hotmail, Yahoo) from seeing the scheduler, keeping it clean. One company goes further by blocking .edu domains as well, while another catches invalid emails at the router level so they fail before booking.
Layer 5: Balanced round robin inside the pod
This is the only layer that all companies share. Companies that receive high demo volumes run a balanced round robin that equalizes lifetime meeting count per rep. A mid-market real estate & property management software company adds weights to the balanced round robin setup, so tenured reps get more leads and new reps ramp gradually.
Layer 6: Recovery routing for non-bookers
A seed-funded SMB manufacturing software company routes follow-up campaign links back to the originally assigned rep instead of through round robin again, preserving continuity. Another company cites that 25% of qualified prospects don't book on first visit, and runs an abandoned-form sequence (email and SMS) with a fresh scheduler link to claw them back.
If you're curious about how these companies manage sophisticated routing logic like this, without drowning in flows, and messy routing workflows, try RevenueHero now.
Weekly Highlights ✨
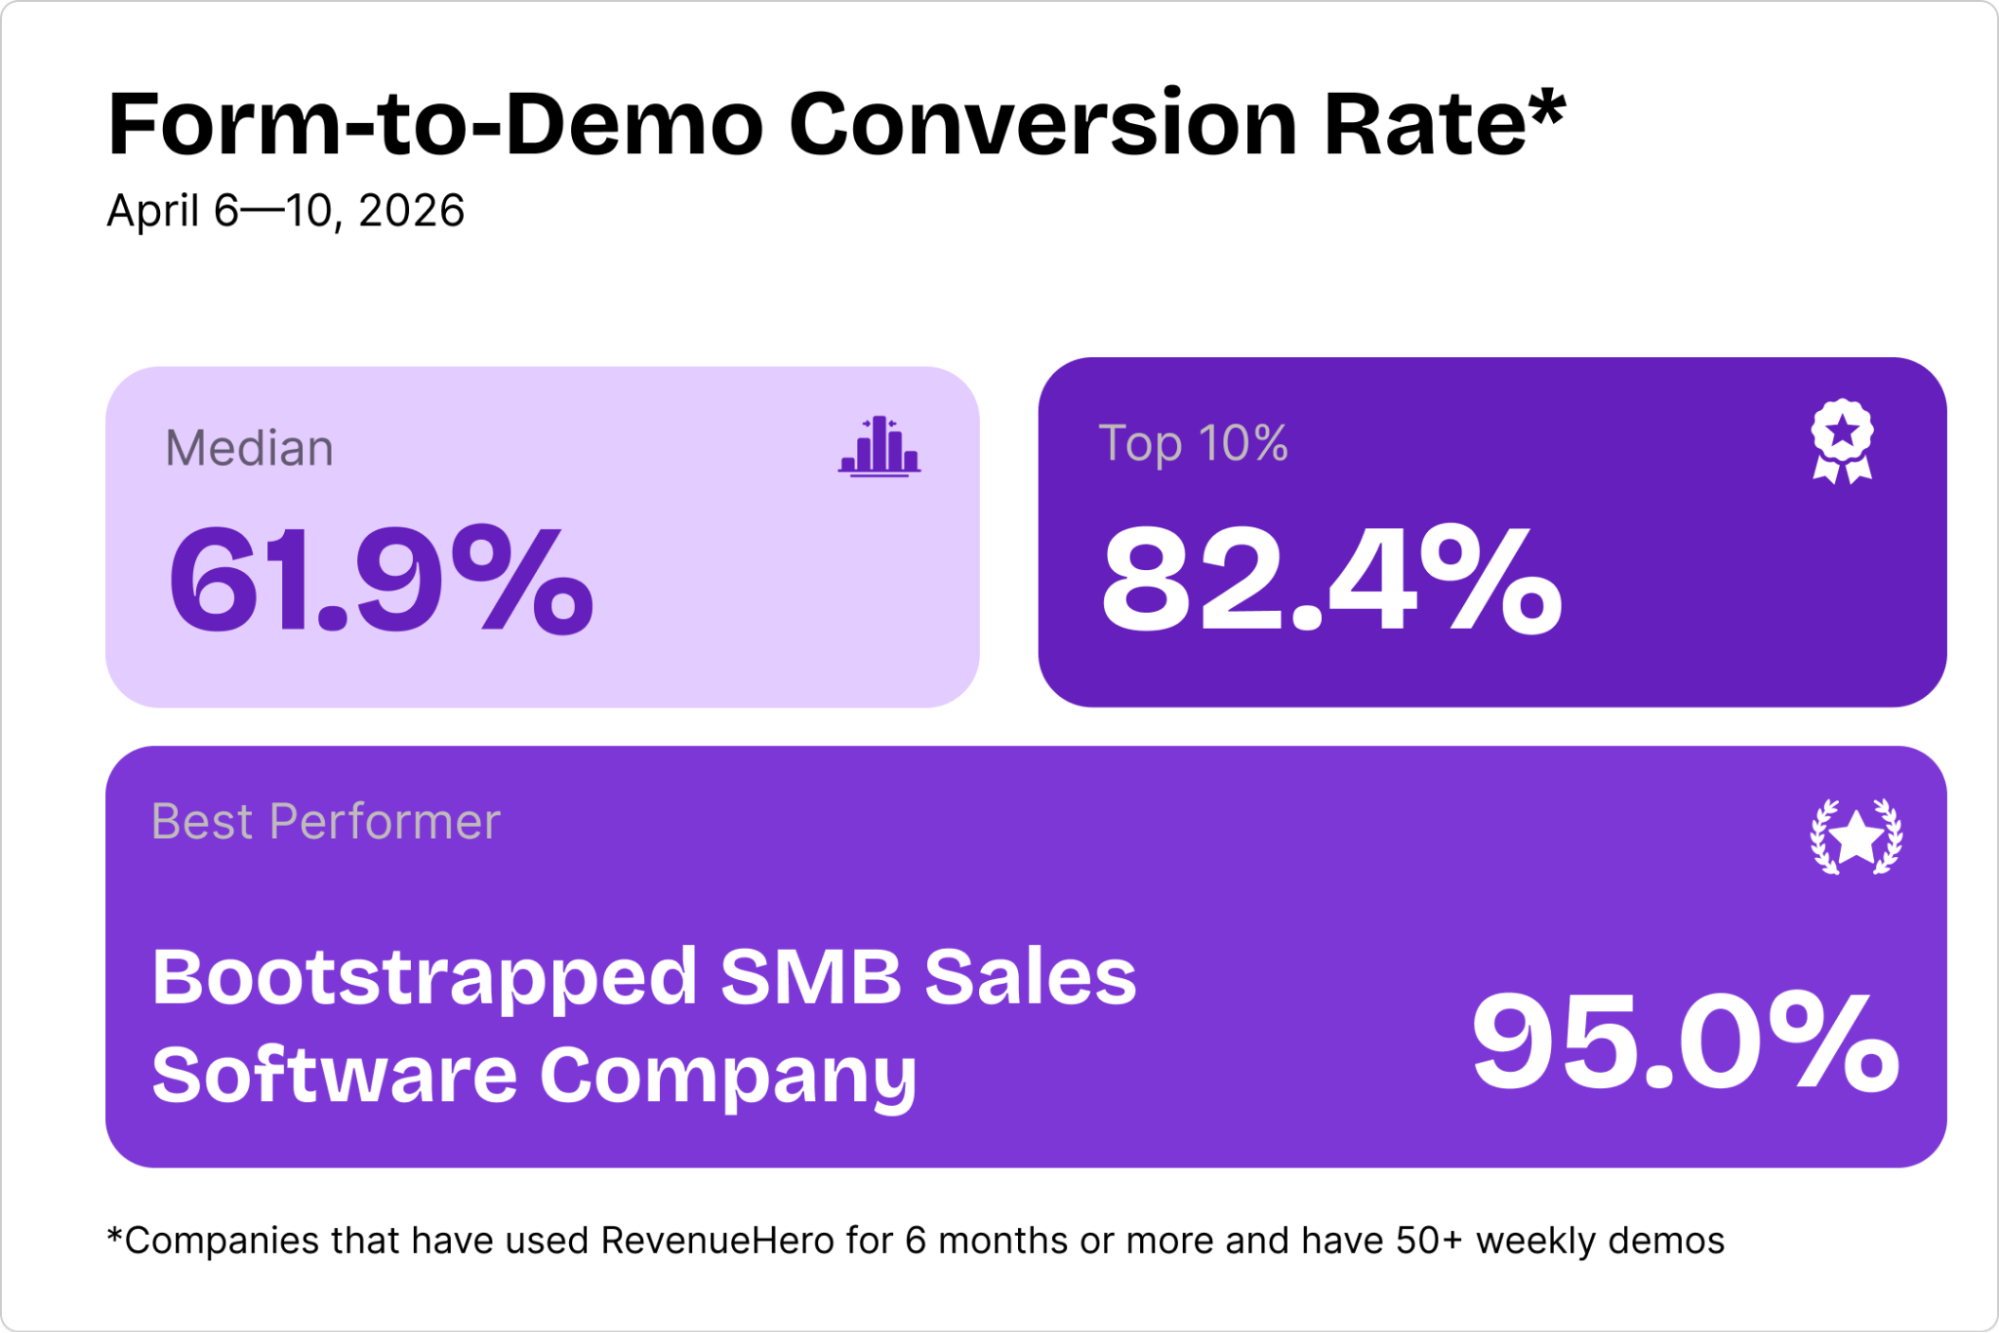
The best performer last week was a bootstrapped SMB sales software company. Here's what we learnt from their demo page:
- The landing page leads with a single CTA "Get a Demo"
- The page features 24 customer logos in a scrolling carousel and 12+ video testimonials from named buyers.
- Trust signals layer in fast: a 4.8-star app rating badge, mention listings per month.
Inbound Snapshot
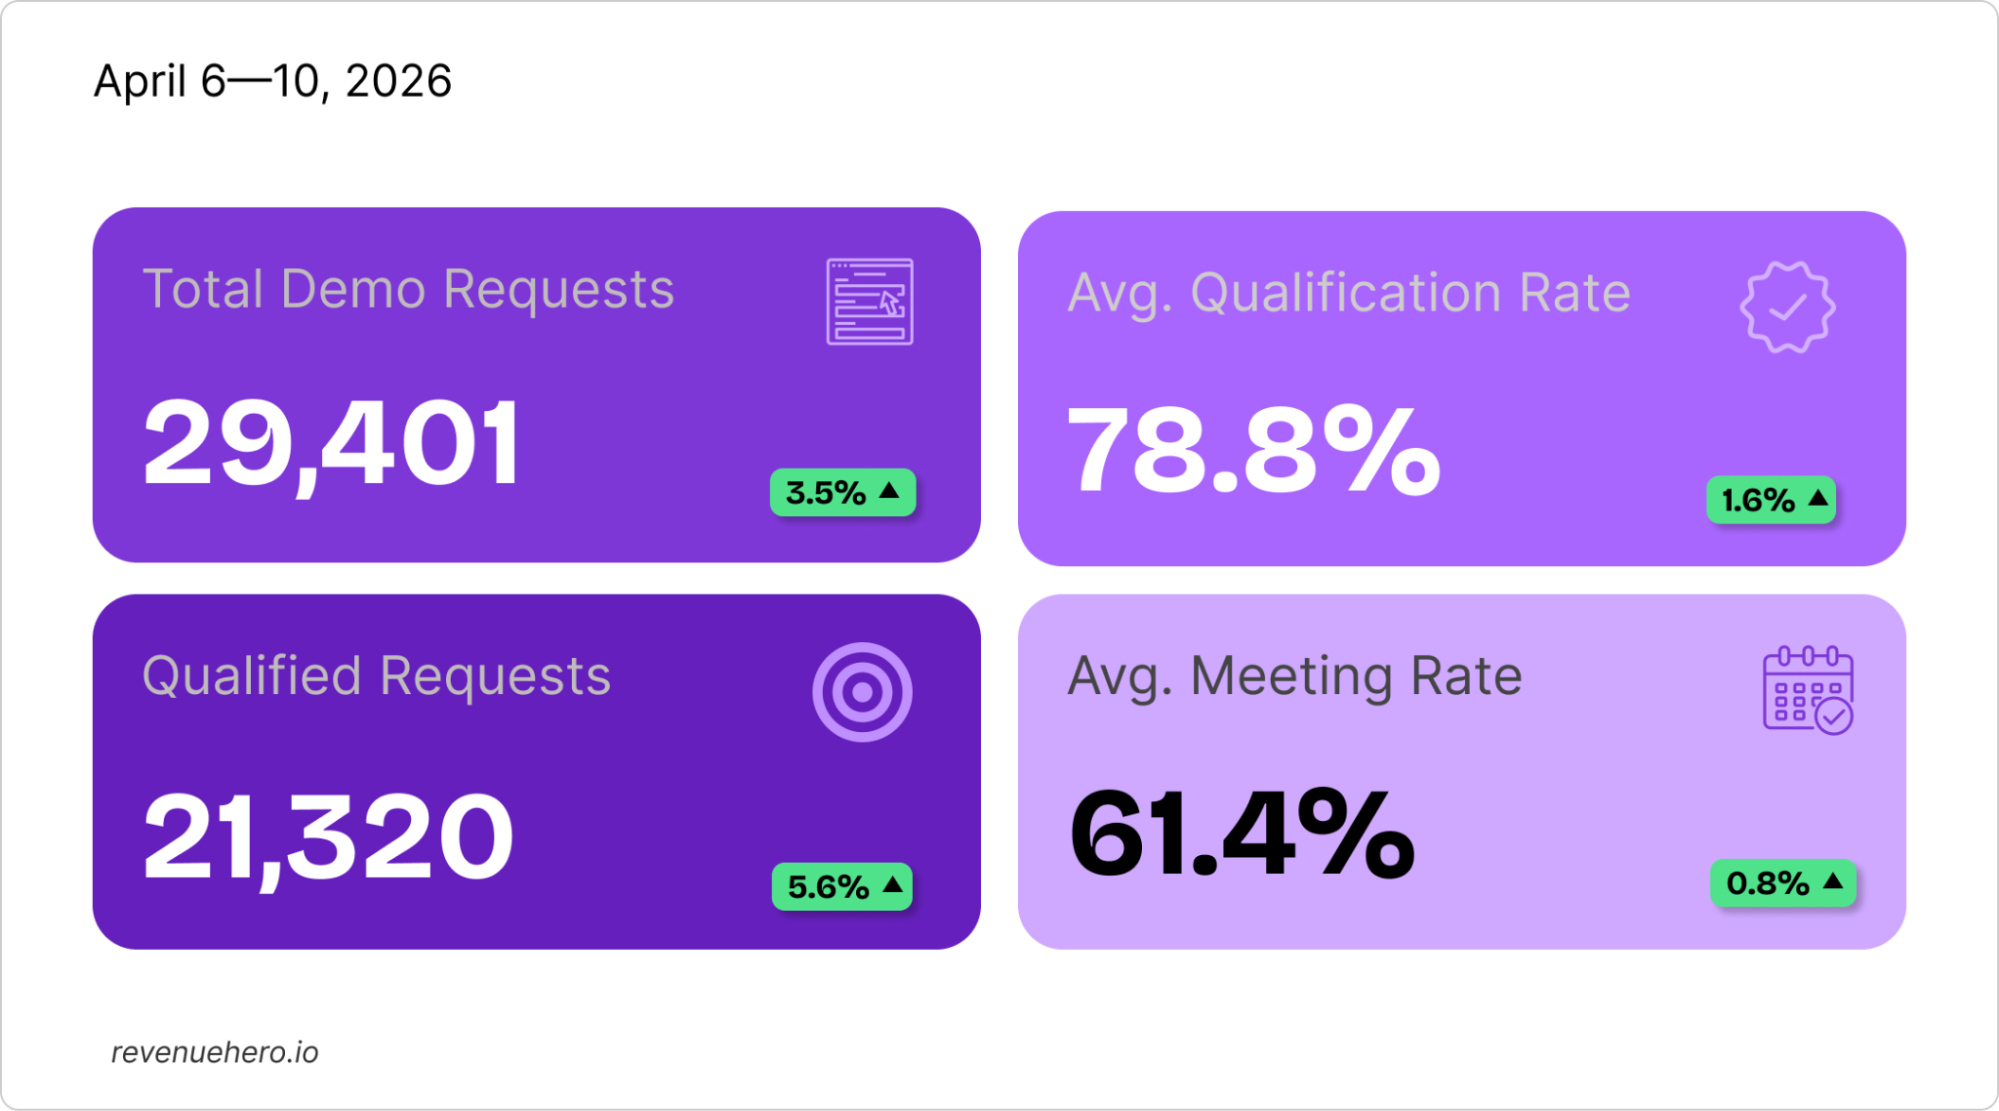
Q2 saw a strong kick-off, with an improvement in both demo request volumes and funnel efficiency. Demo requests saw a 3.5% surge last week, with qualified demos spiking 5.6% compared to the previous week.
Qualification rates improved to 78.8%, while form-to-demo conversion rates nudged up by 0.8% to signify early recovery from March numbers, holding at 61.4%.
Segment Snapshot
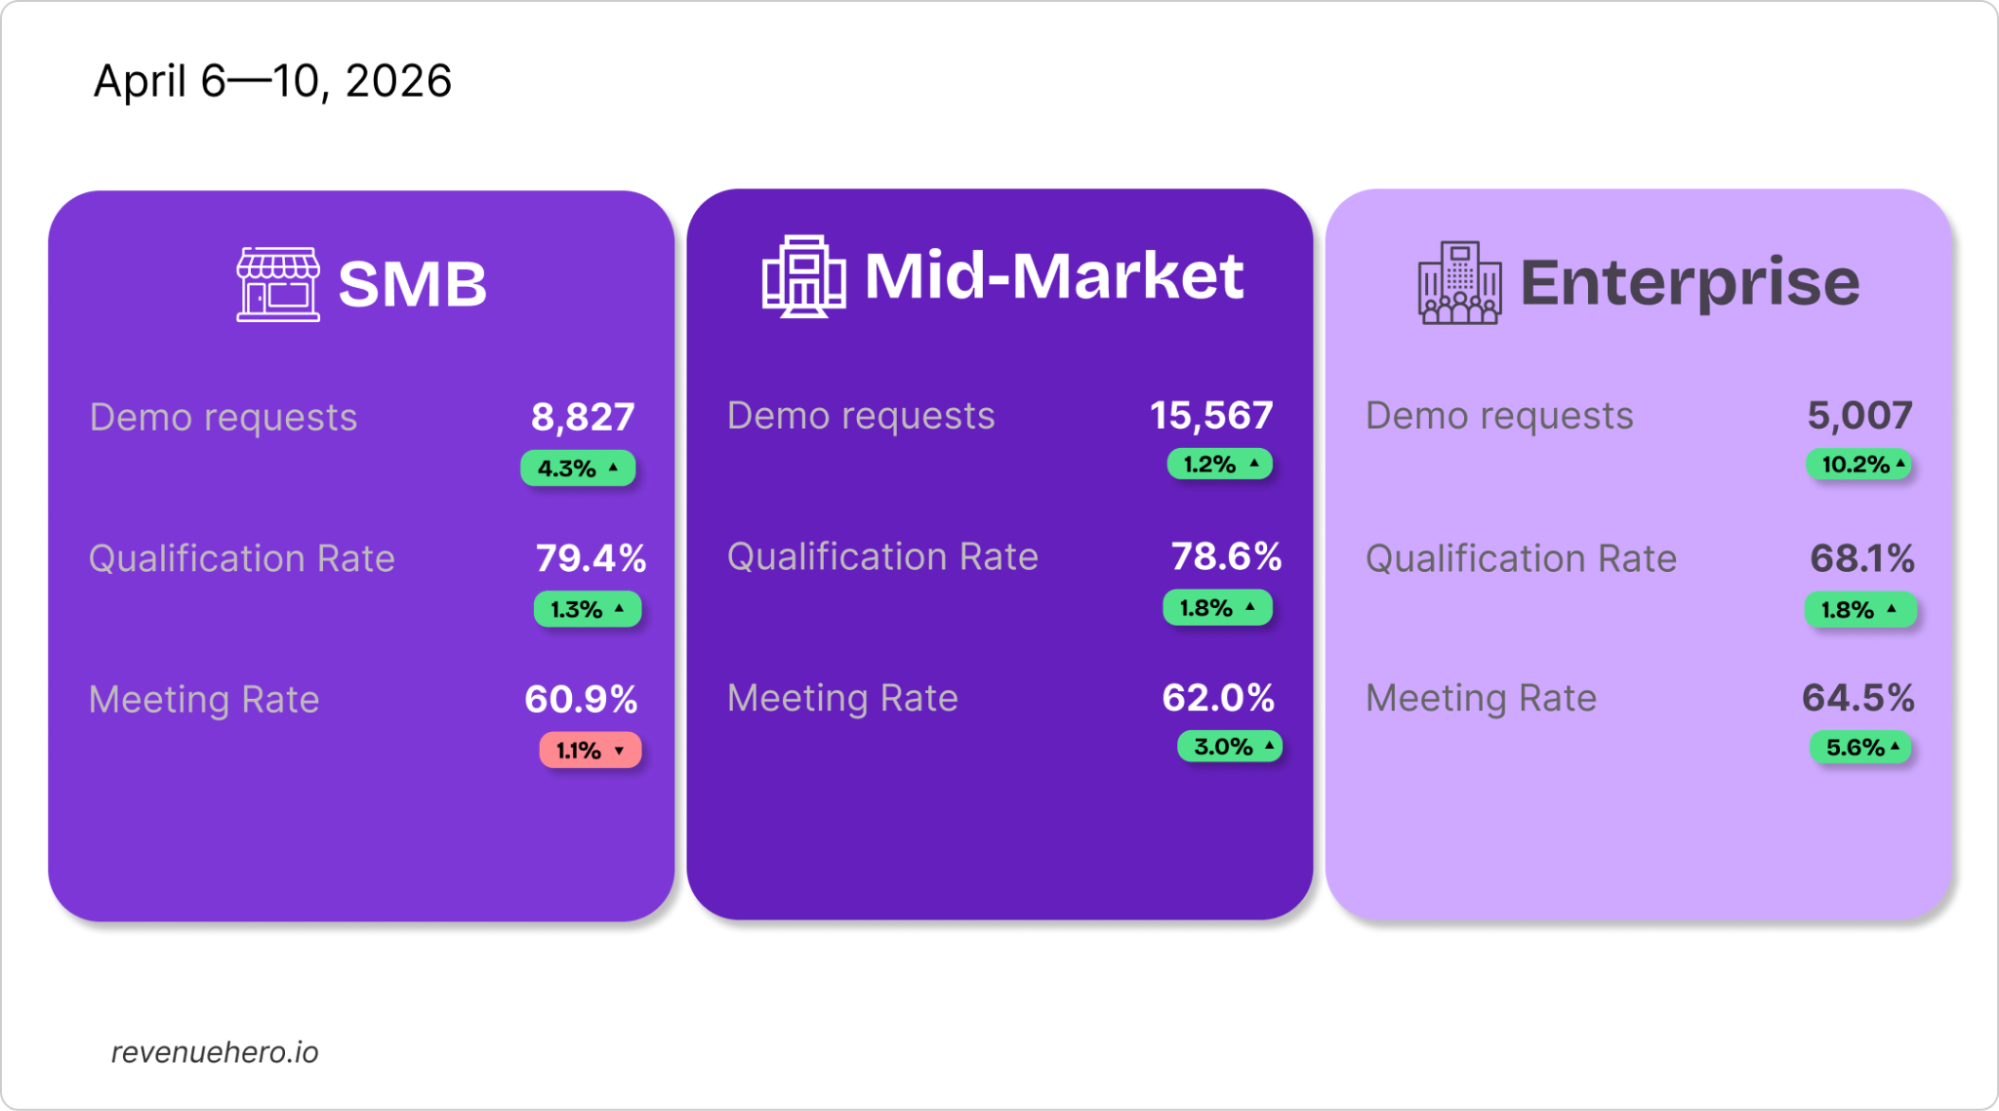
SMB saw 4.3% more demo requests flowing in last week, and their qualification rates also increased by 1.3%. However, this impacted their form-to-demo conversion rates, as the average slipped 1.1% from 62% to 60.9%.
Mid market saw a slight uptick in demo request volumes and qualification rates, 1.2% and 1.8% respectively. The segment also improved their average meeting conversion rates from 59% to 62%.
Enterprise witnessed the best opening week for Q2: with a 10.2% increase in demo request volumes, a 1.8% uptick in qualification rates, and a 5.6% surge in form-to-demo conversion rates that put its average ahead of the other two segments at 64.5%.
Funding Stage Analysis
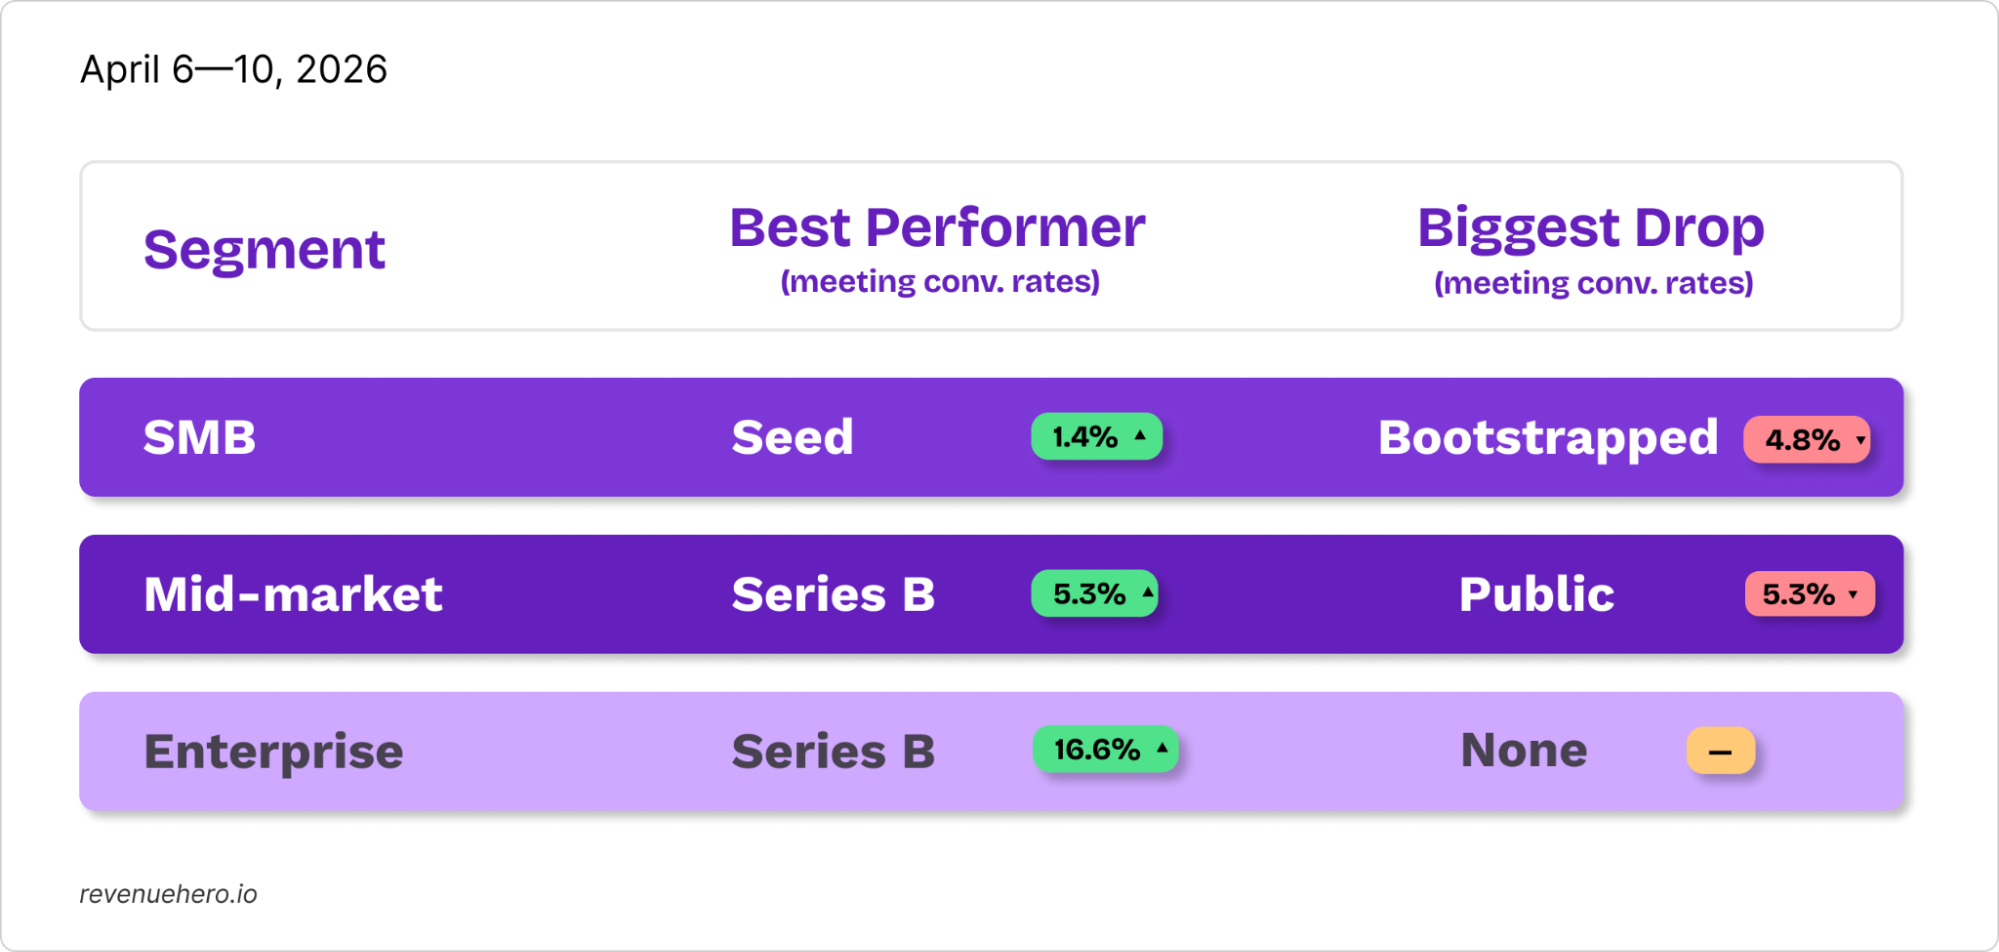
Enterprise Series B skyrocketed +16.6% to 38.9%, the biggest single-stage spike of the quarter. Enterprise Series D jumped +8.1% to 65.7%, while Series C jumped +5.8% to 92.0%, the highest reading any cohort produced this week.
On the other end, Mid-Market public dropped -5.3%, while SMB bootstrapped dipped -4.8%, and mid-market Series C dipped -4.7% to 57.6%. If you belong to any of these cohorts, audit your demo page for any discrepancies.
Industry-wise Meeting Rates
Retail & e-commerce software saw a sharp spike of 7%, putting it in the 3rd position for last week's leaderboard. IT & security software saw the second-biggest increase in form-to-demo conversion rates (6%), followed by data & analytics with a 5.3% surge.
Legal & compliance saw the biggest drop of 7.9%, falling below the 25th percentile last week. Developer tools also saw a 7.5% slide in conversion rates, while support software saw a 6% drop.
No industry exceeded 70% average meeting conversion rate last week. All industries except developer tools converted 50%+ of their qualified inbounds into booked meetings, with 53% of industries witnessing steady or better form-to-demo conversion rates.
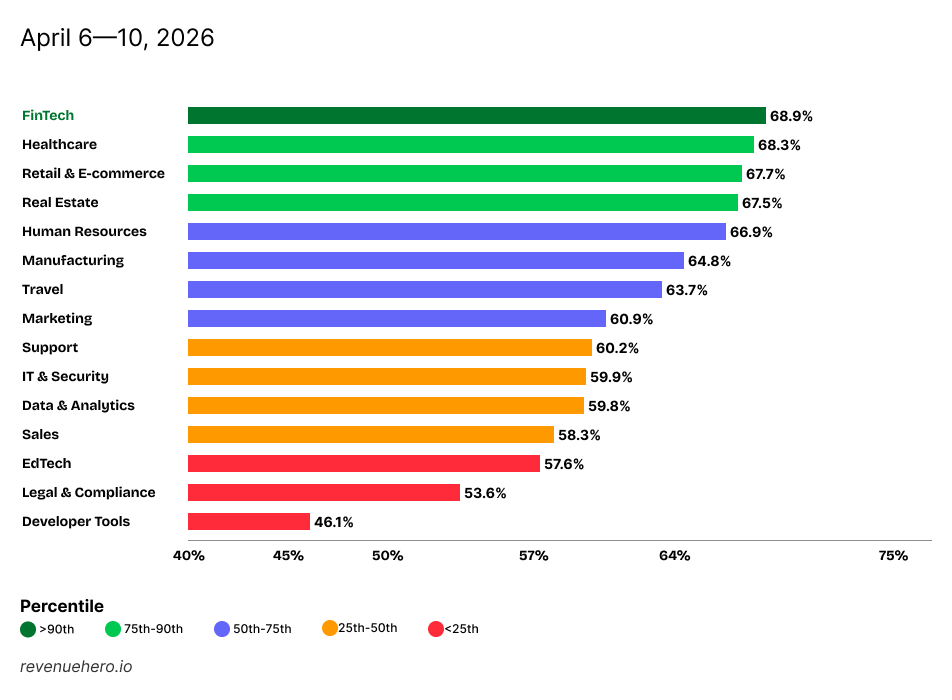
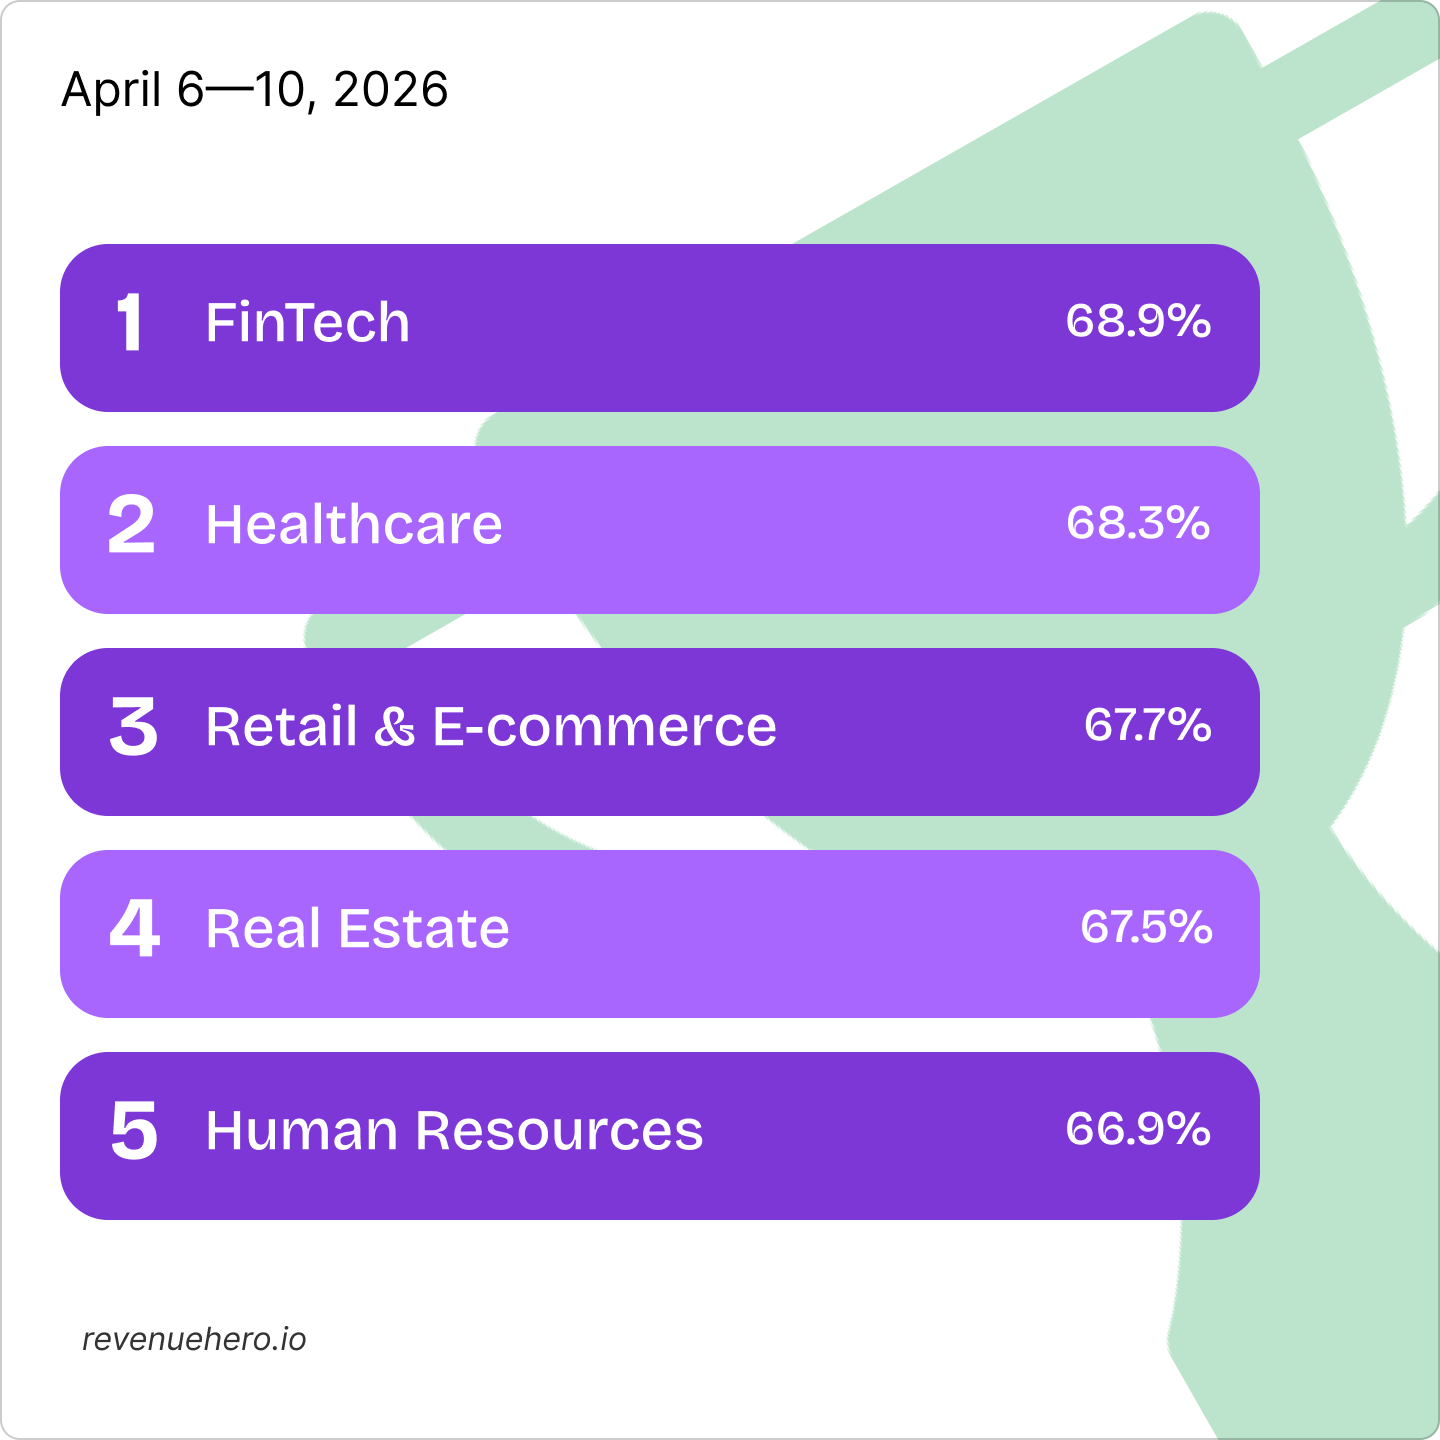
Top Performers
FinTech reclaimed the #1 spot from healthcare with an average form-to-demo conversion rate of 68.9%, which missed the top spot by a whisker (0.6%). Retail & e-commerce completed the podium with a conversion rate of 67.7%.
Key Observations
- The funnel grew on both sides this week: Demo requests rose +3.5% to 29,401 and qualified requests jumped +5.6% to 21,320, snapping a three-week volume slide. Meeting rates remained steady at 61.4% (+0.8%) and qualification ticked up +1.6% to 78.8%.
- SMB ticked down -1.1% to 60.9%, even with a +4.3% volume rise. Bootstrapped SMB dipped -4.8% to 51.2%, the lowest reading the cohort has produced all quarter.
- Mid-Market climbed +3.0% in MR to 62.0%, its best reading since Week 13. Mid-Market Series B jumped +5.3% to 65.9%, an all-time high for that cohort.
- Enterprise was the breakout segment: Demo requests soared +10.2% to 5,007, the biggest single-segment volume jump of Q2 so far. Meeting rates jumped +5.6% to 64.5%, the highest Enterprise reading in the dataset.
- FinTech took the #1 industry spot from Healthcare at 68.9%, its first crown since Week 10. Healthcare dipped -4.7% to 68.3%.
- Biggest wins: Retail & e-commerce (+7.1%), IT & security (+6.0%), data & analytics (+5.3%).
- Biggest drops: Legal & Compliance (-7.9%), developer tools (-7.5%), support (-6.0%).
We'll be back next week with a fresh batch ✨
Until then, keep those meetings flowing 📈


