


Welcome to the sixteenth edition of Breaking Inbound, your weekly deep-dive into inbound numbers and form-to-demo conversion rates across industries.
Last week, one of our customers received 276 demo requests. Their form fill-to-booked meeting conversion rate hit an all-time high of 85%, i.e., more than eight out of 10 handraisers booked meetings.

39 of our customers pulled off the same trick: higher conversions with fewer demos. And that’s precisely the pipeline paradox.
So how does chasing more pipeline work counterintuitively? And how does the “fewer demos = more conversions” math add up?
Read the full story below ⬇️
The Pipeline Paradox ↔️ Lead quality fixes what lead volume broke
B2B marketers love this phrase more than anything else. You hear it in sync-ups, meetings, and every quarterly review.

Generating more leads is the default growth play in B2B. More content → More ads → More eyeballs → More leads → More demo requests.
So when we saw the data, our jaws dropped (slightly).
We tracked every company across 16 weeks of Breaking Inbound data, and among the companies with 50+ weekly demo requests, 57 companies saw an increase in demo request volumes, but their meeting rates either remained steady or slid down a few points.
Meanwhile, 39 saw a dip in their lead volumes, but their targeting was spot on; which in turn improved their meeting conversion rates. And none of them sacrificed pipeline because of fewer demos. They worked with a concentrated pipeline.
#1: Series C Mid market software
While their demo request volumes fell 34% over 16 weeks, their form-to-demo conversion rates soared from 34.6% to 75%! But here’s the best part: they went from under 10 booked meetings per week to 50+. Their conversions skyrocketed and the absolute output exploded.
#2: Series C Mid market Developer Tools software
They cut demo request volumes by 60%, and their inbound conversion rates improved 4x. Booked meetings doubled from 30 to 60+, because they understood the simple truth: the visitors who stopped showing up were never going to book anyway.
#3: Series E Enterprise FinTech software
Their demo requests volumes kept dropping from Week 14, and conversely, their form-to-demo conversion rates kept improving: 78.8% in Week 14, 81.5% in Week 15, and 85% last week. Their demo page does the qualifying for them; and the fewer people who fill out the form, the better each one converts.
#4: Series C Enterprise Sales software
Despite an 18% fall in demo request volumes, they improved their conversion rates from 57% to 88%. Also, they run a very high DQ rate of 95%, allowing only a few to see the calendar. But 88% of those book a meeting, and that number has trended upward for months.
Now flip the script: what happens when demo request volumes spike?
#1: Series A SMB EdTech software
Their demo request volume almost doubled from Week 15 to last week, but their form-to-demo rates dropped from 63% to 47%.
#2: Series A SMB Support software
They doubled their demos steadily over a few weeks. But their meeting rates collapsed from 62% to 22%: a 40% plunge!
#3: Series A Mid market IT & Security software
They saw a 3x increase in their demo request volumes, but their meeting rates took a grave hit: plunging 30%. While the volume went up, the new traffic wasn’t qualified.
The companies that are converting better on less volume have two levers working together:
Lever 1: Optimized form-to-booked meeting conversion
Our analysis of 50 top-performing demo pages found that form length (i.e., the number of fields on a demo form) barely affects conversion. Forms with 13 fields converted nearly identical to forms with 2 fields. The form design must be intentional:
- Dropdowns for key qualifying fields (company size, product interest)
- Conditional logic (for routing qualified visitors instantly)
This ensures that once someone qualifies, getting the booked meeting isn’t left to chance.
Lever 2: Tighten upstream targeting
The companies on the “more demos, less meeting rate” list grew top-of-funnel traffic without adjusting who they attracted. The “less is more” companies did the opposite and narrowed their targeting: sharper ad audiences, more specific landing pages, and content that qualifies intentionally. So fewer visitors arrived, but a higher share of them matched the ICP.
These two levers make the math simple.
Tighter targeting means a higher percentage of form submissions are real buyers. And a well-designed form (paired with impeccable routing logic) means those buyers see a rep’s calendar in seconds. And the result? Eight out of ten demos turn into booked meetings.
So the companies who hit above 75%? There’s no magic behind it, just the predictable output of these two levers.
After all, the industry narrative needs to change from “generate ‘more’ pipeline” to “generate ‘better’ pipeline”.
Onto the regular weekly numbers now ⬇️
Weekly Highlights ✨
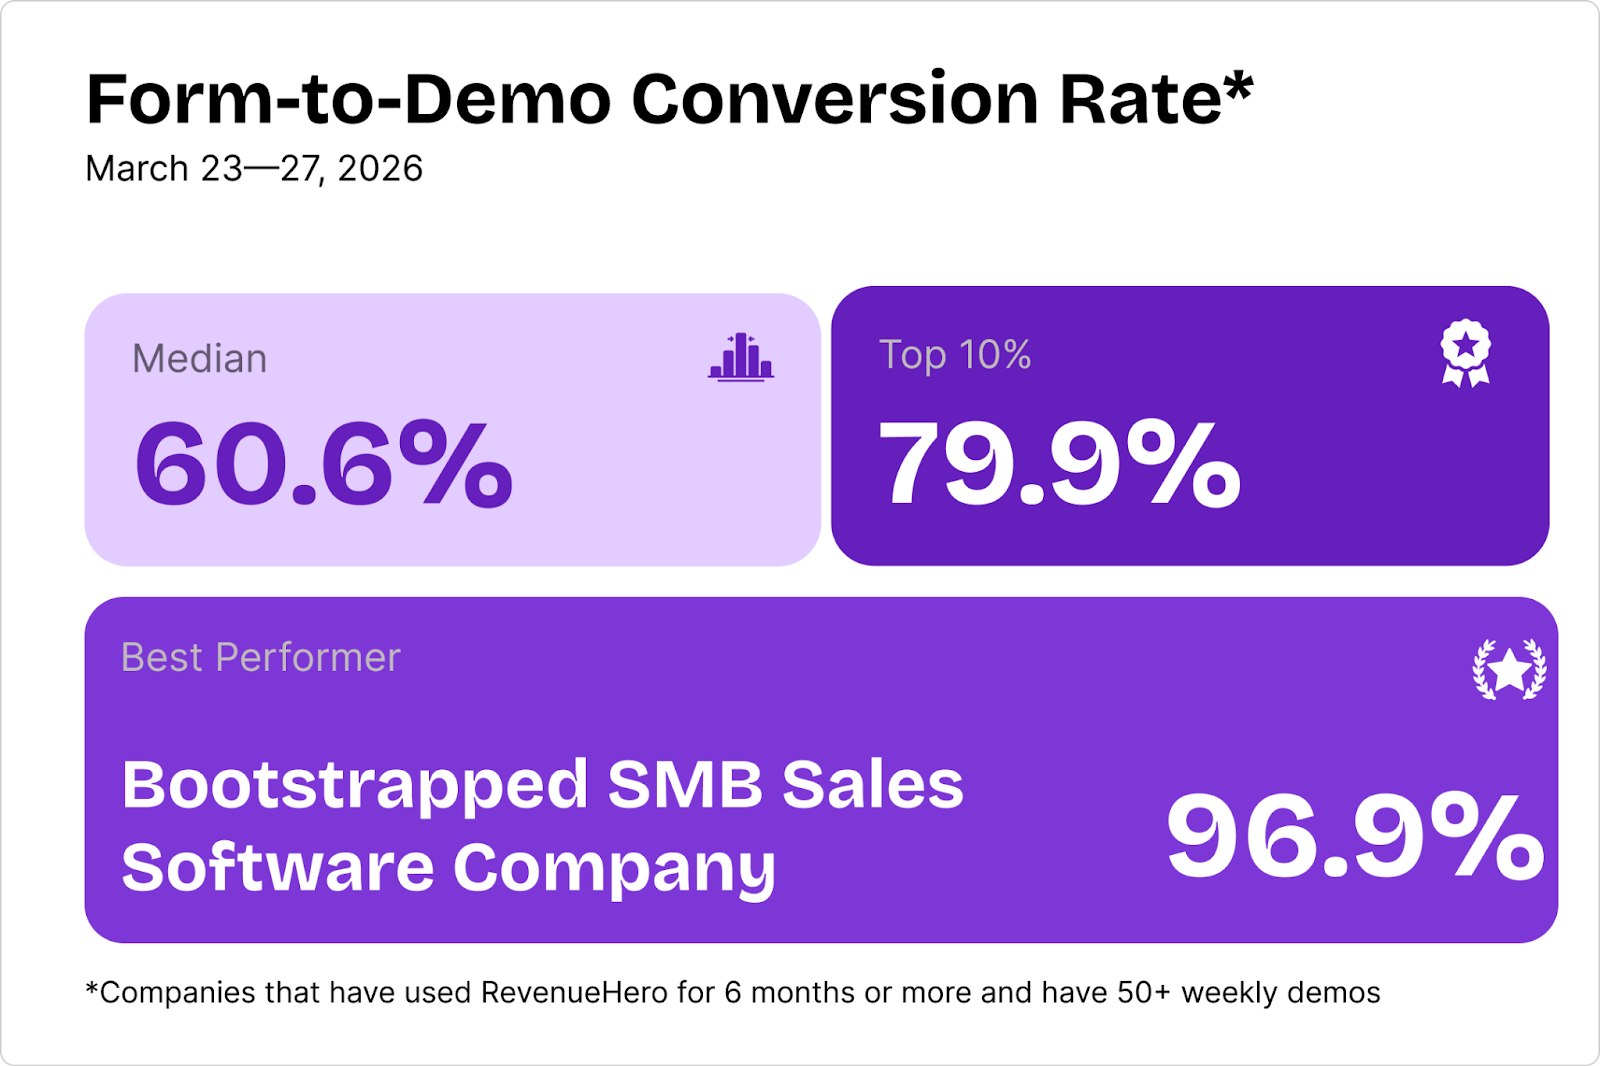
The best performer last week was a Bootstrapped SMB Sales software company. Here’s what we learnt from their demo page:
- They offer a free trial and use “Talk to an expert” as their CTA
- Their demo page shows 4 customer testimonials with specific product value & 10 customer logos
- Their demo form has 12 fields, with 5 fields that help them in lead qualification
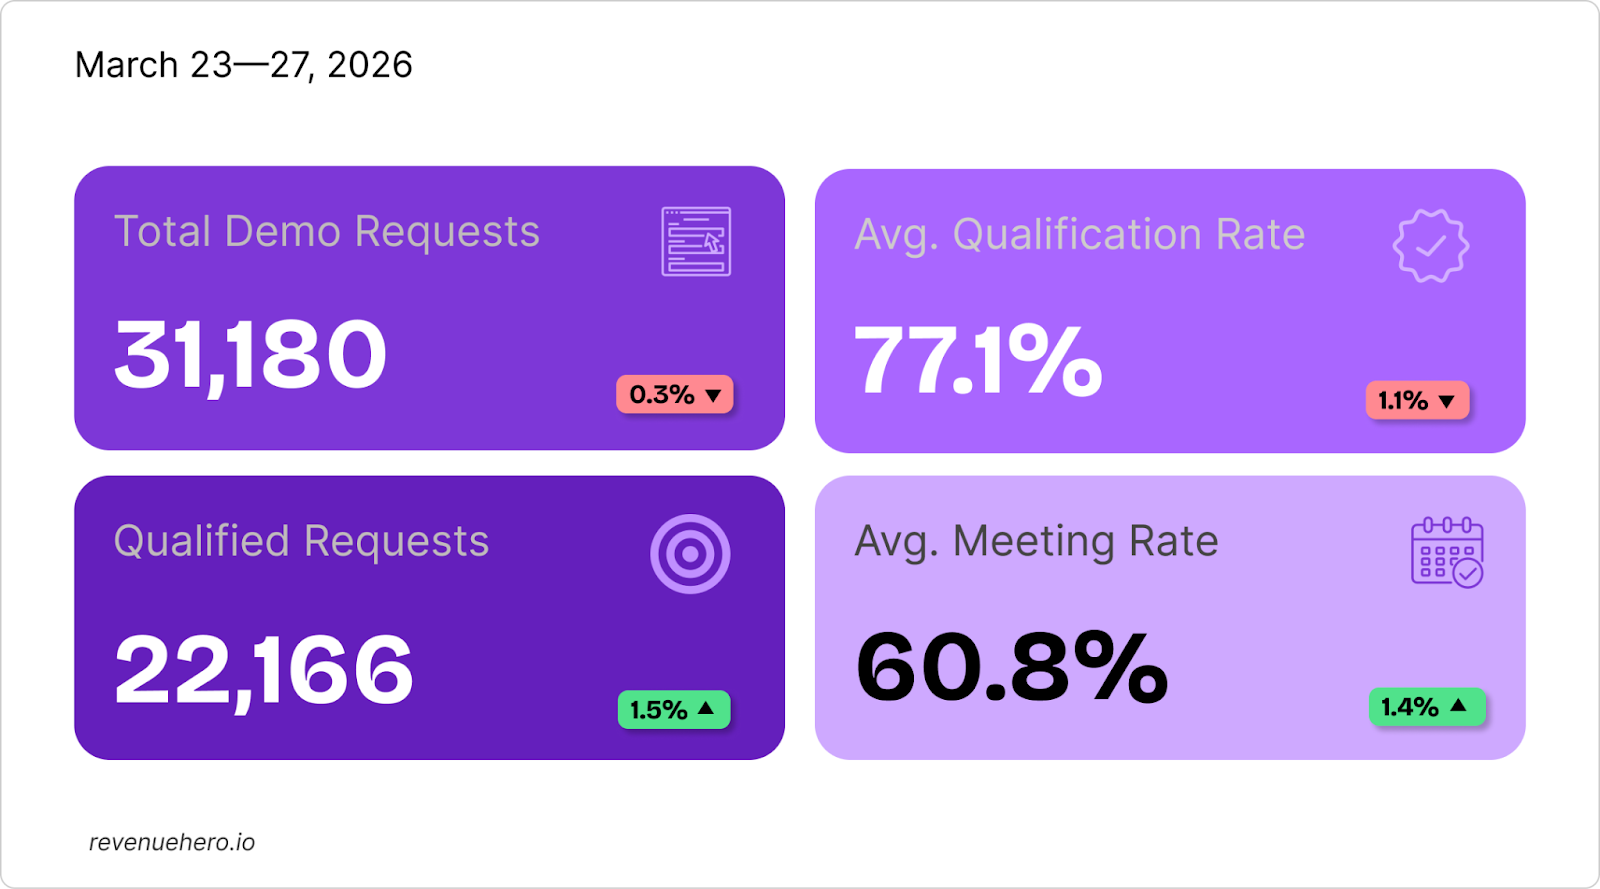
Inbound Snapshot
Demand held steady this week, while conversion ticked up. Qualified requests saw a +1.5% improvement, despite the average qualification rate slipping -1.1% to 77.1%. Form-to-demo conversion rates nudged up +1.4% to 60.8%.
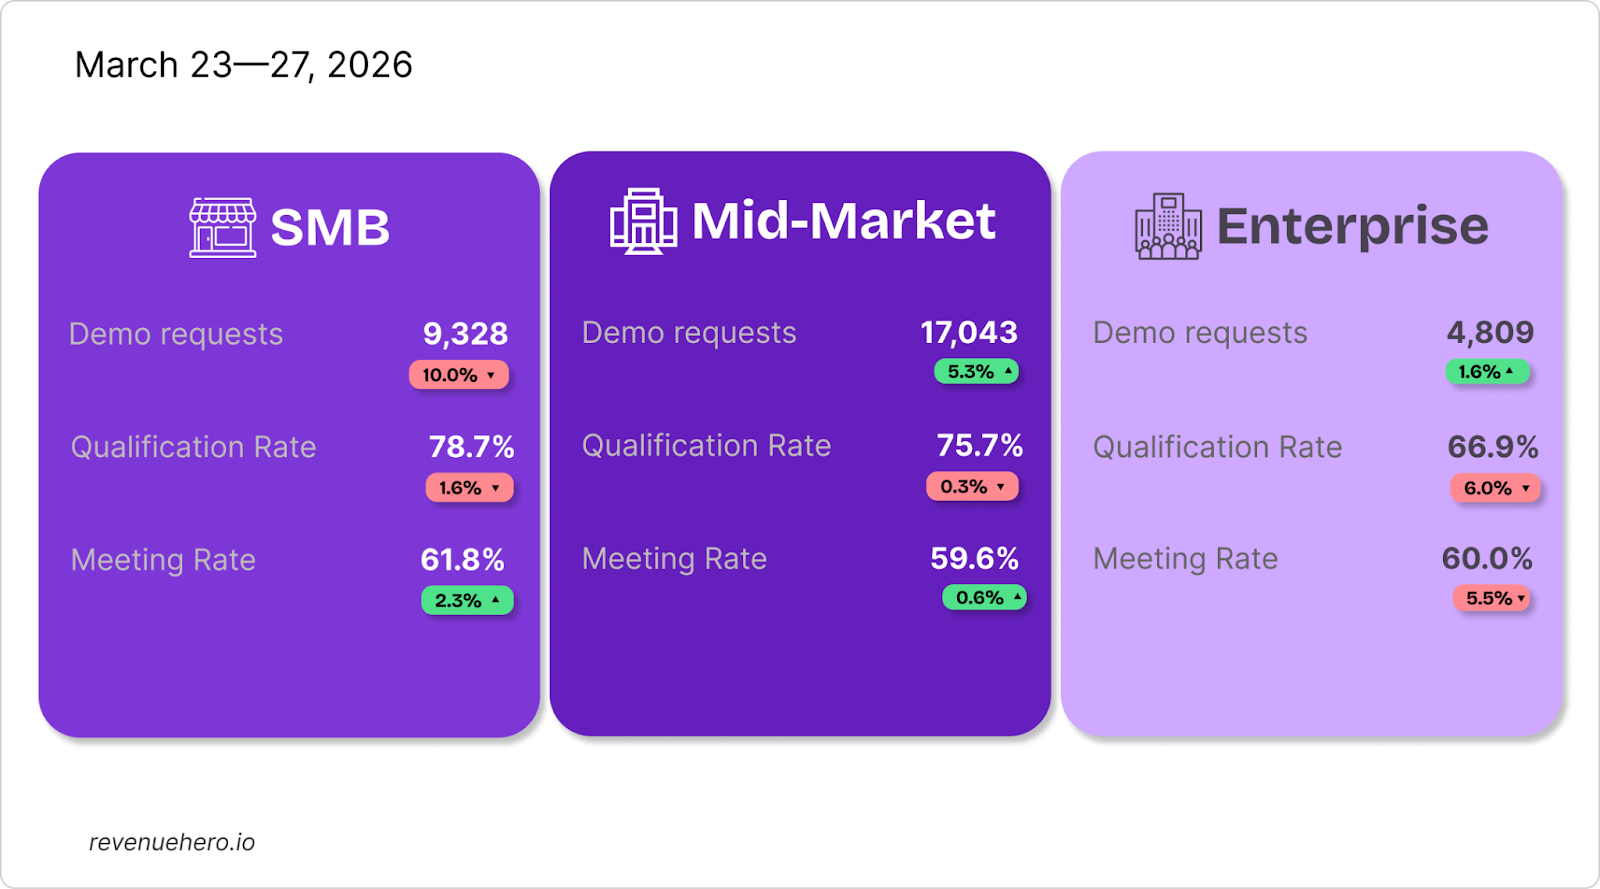
Segment Snapshot
SMB pulled back on volume but gained efficiency. While demo requests dropped 9.9%, form-to-demo conversion rates ticked up 2.3%: the highest among all segments. Fewer visitors came in, but more meetings were booked.
Mid market saw a slight uptick in conversion rates (0.6% growth) with a 5.3% spike in demo request volumes. Their qualification rates held steady compared to the previous week (75.7% vs. 76%).
Enterprise lost its gains: there was a slight improvement in demo requests, but both qualification rates (-6%) and form-to-demo conversion rates (-5.5%) saw a decline.
Funding Stage Analysis
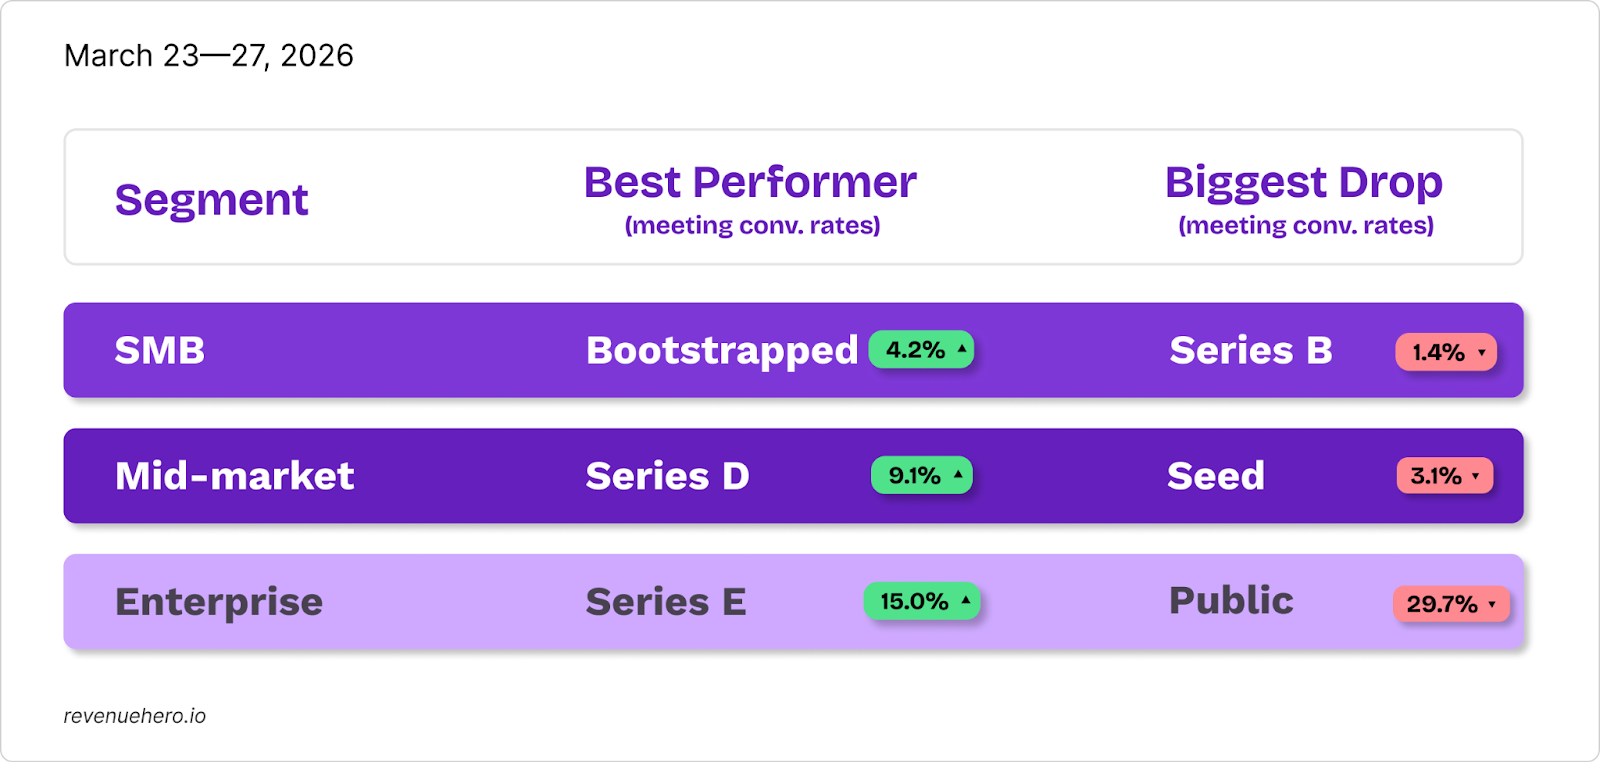
Enterprise Series E catapulted 15.0% in form-to-demo conversions, from 68.5% to 83.5% last week. Mid-market Series D surged 9.1%.
On the other end, Enterprise Public companies tumbled 29.7%, falling to 50.7%. If you fall in this category, head over to your demo page to see what's stopping your prospect from booking a demo.
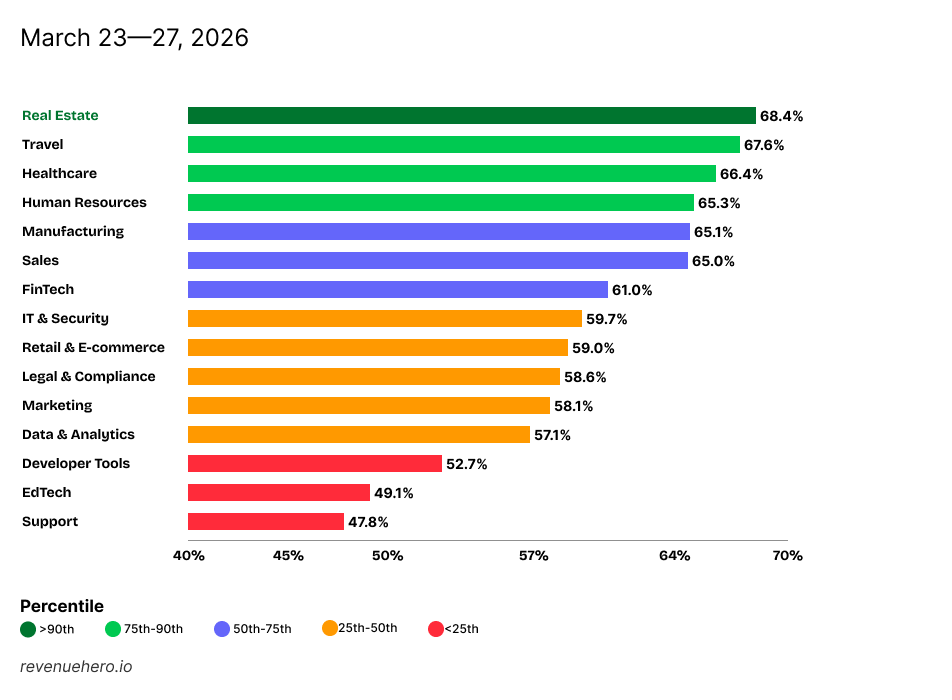
Industry-wise Meeting Rates
This was the first in the last 16 weeks where no industry crossed the 70%+ threshold of form-to-demo conversion rates.
Real estate came out on top with 68.4% to steal the #1 spot from Healthcare, which slid to the third spot with an average form-to-demo conversion rate of 66.4%.
Travel & hospitality saw the biggest improvement last week, with a 10% surge in conversion rates, helping the industry to take the second spot with a 67.6% form-to- demo conversion rate.
Legal & compliance dropped 7.1% and fell below the 50th percentile, and Support took a 7% decline as well, falling to the last place in the leaderboard.
Except for edtech and support, all industries converted 50%+ of their qualified inbounds into booked meetings, and 53% of industries saw steady or better conversion rates.
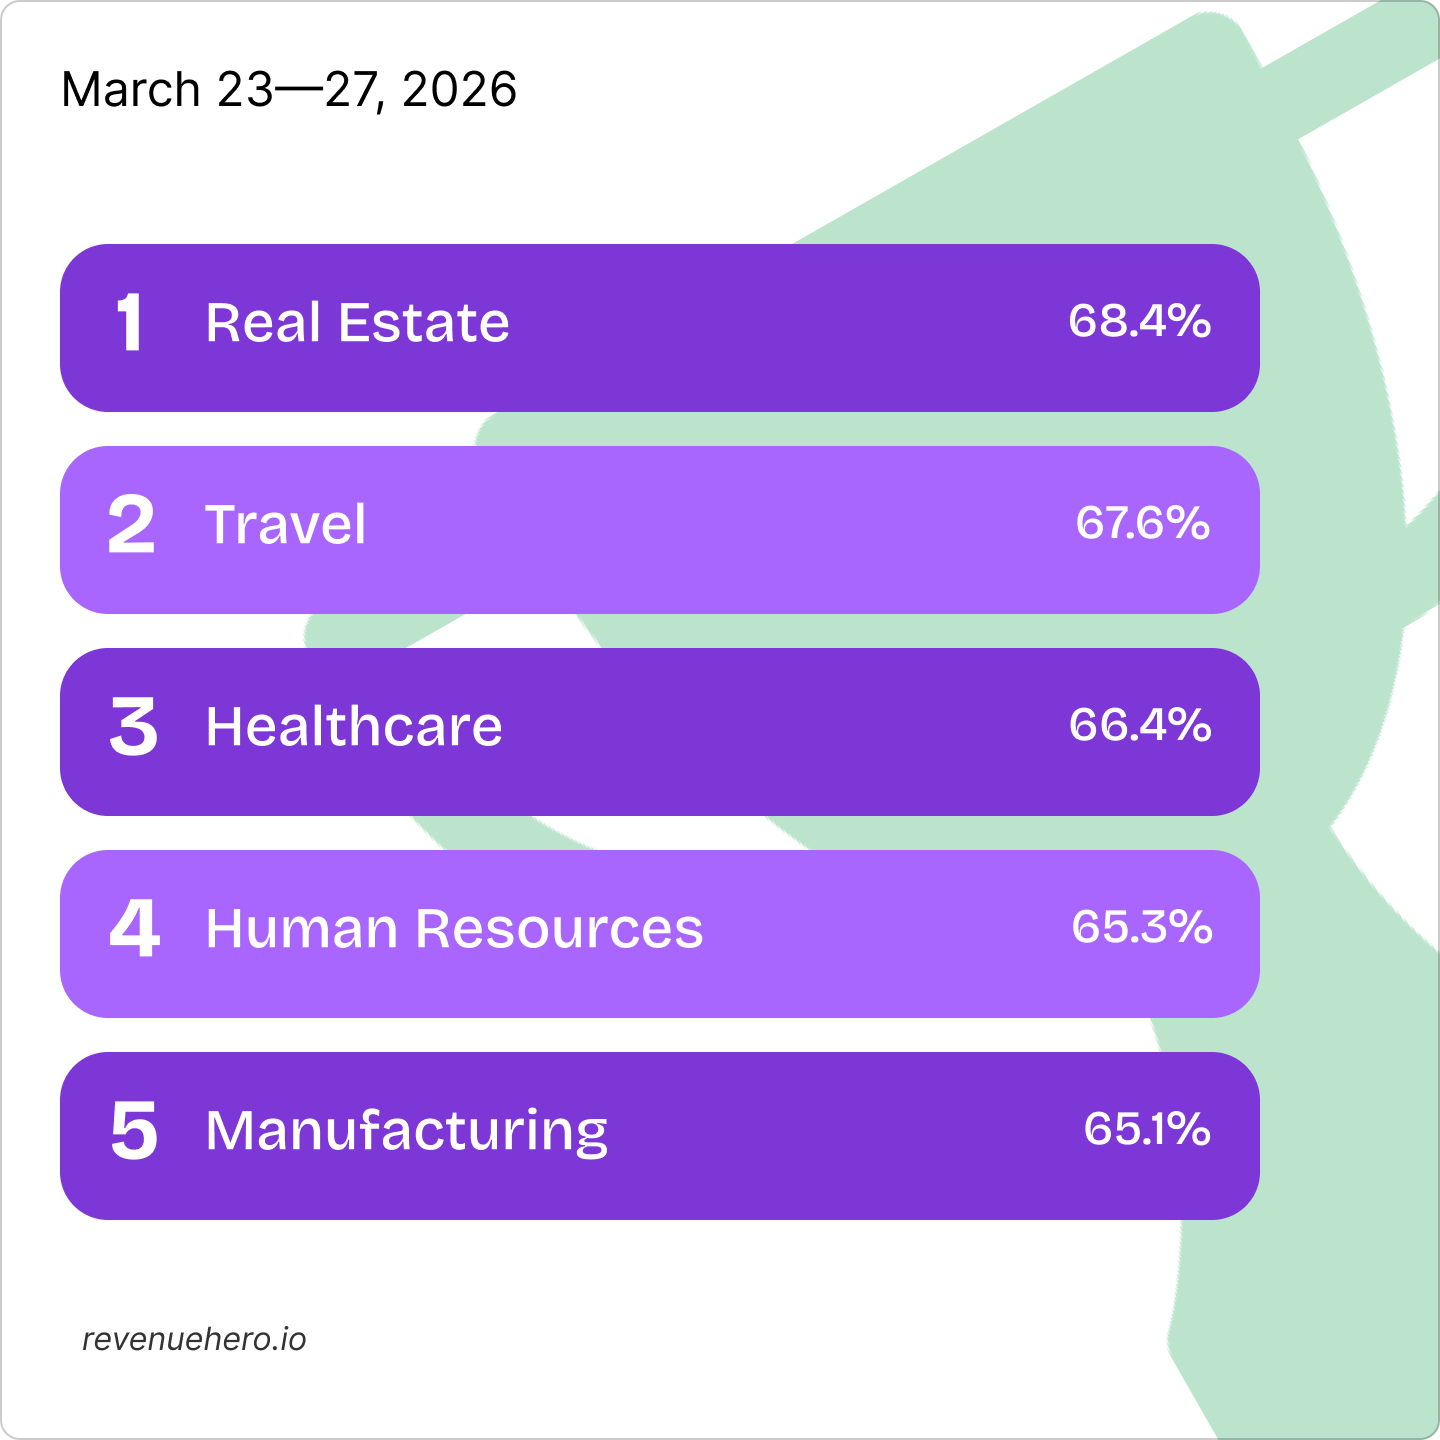
Top Performers
Real Estate became the table-topper at 68.4%, followed closely by travel at 67.6%. Healthcare completed the podium with 66.4%.
Key Observations
- Form-to-demo conversion rates improved to 60.8% (+1.4%) on flat demo volume (31,180, -0.3%). The funnel has never converted this well on stable input.
- SMB dropped demo volume -9.9% but meeting rates ticked up +2.3% to 61.8%, leading all segments.
- Enterprise gave back last week's gains, falling -5.4% to 60.0% after loosening qualification.
- Enterprise Enterprise Series C soared +15.0% to 88.2%, while Series D plummeted -29.7% to 50.0%**, erasing last week's spike.
- Travel soared +10.1% to 67.6%, the biggest industry move. Sales surged +8.3% to 65.0%, its best reading ever.
- FinTech's decline extended to seven straight weeks (78.2% in Week 10 to 61.0% now), the longest streak of any industry in the dataset.
- Real Estate claimed the #1 industry spot for the first time at 68.4%. Travel grabbed the second spot, while healthcare lost 6.8%, dropping to 66.4%.
We'll be back next week with a fresh batch ✨
Until then, keep those meetings flowing 📈


