


Welcome to the fourteenth edition of Breaking Inbound, your weekly deep-dive into inbound numbers and form-to-demo conversion rates across industries.
Over the past 14 weeks, we’ve seen form-to-demo conversion rates swing wildly, week after week.

Take this week, for example. Legal & compliance, which was leading last week, took an 18% plunge. Its form-to-demo conversion rates fell below the 25th percentile 📉
While industries are susceptible to conversion rate see-saws, a small group of companies has cracked the code for conversion consistency, hitting 80%+ for 11 straight weeks. And their playbooks have been hiding in plain sight: their demo pages.
Read the full breakdown below ⬇️
The 80%+ form-to-demo conversion playbook 🔥
Across 14 weeks of Breaking Inbound data, most companies oscillate between 40% and 70% meeting rates, depending on the week. Industry averages rise or fall by 15-18% within a single week.
And there are these eight companies (I’ve anonymized the names for privacy):
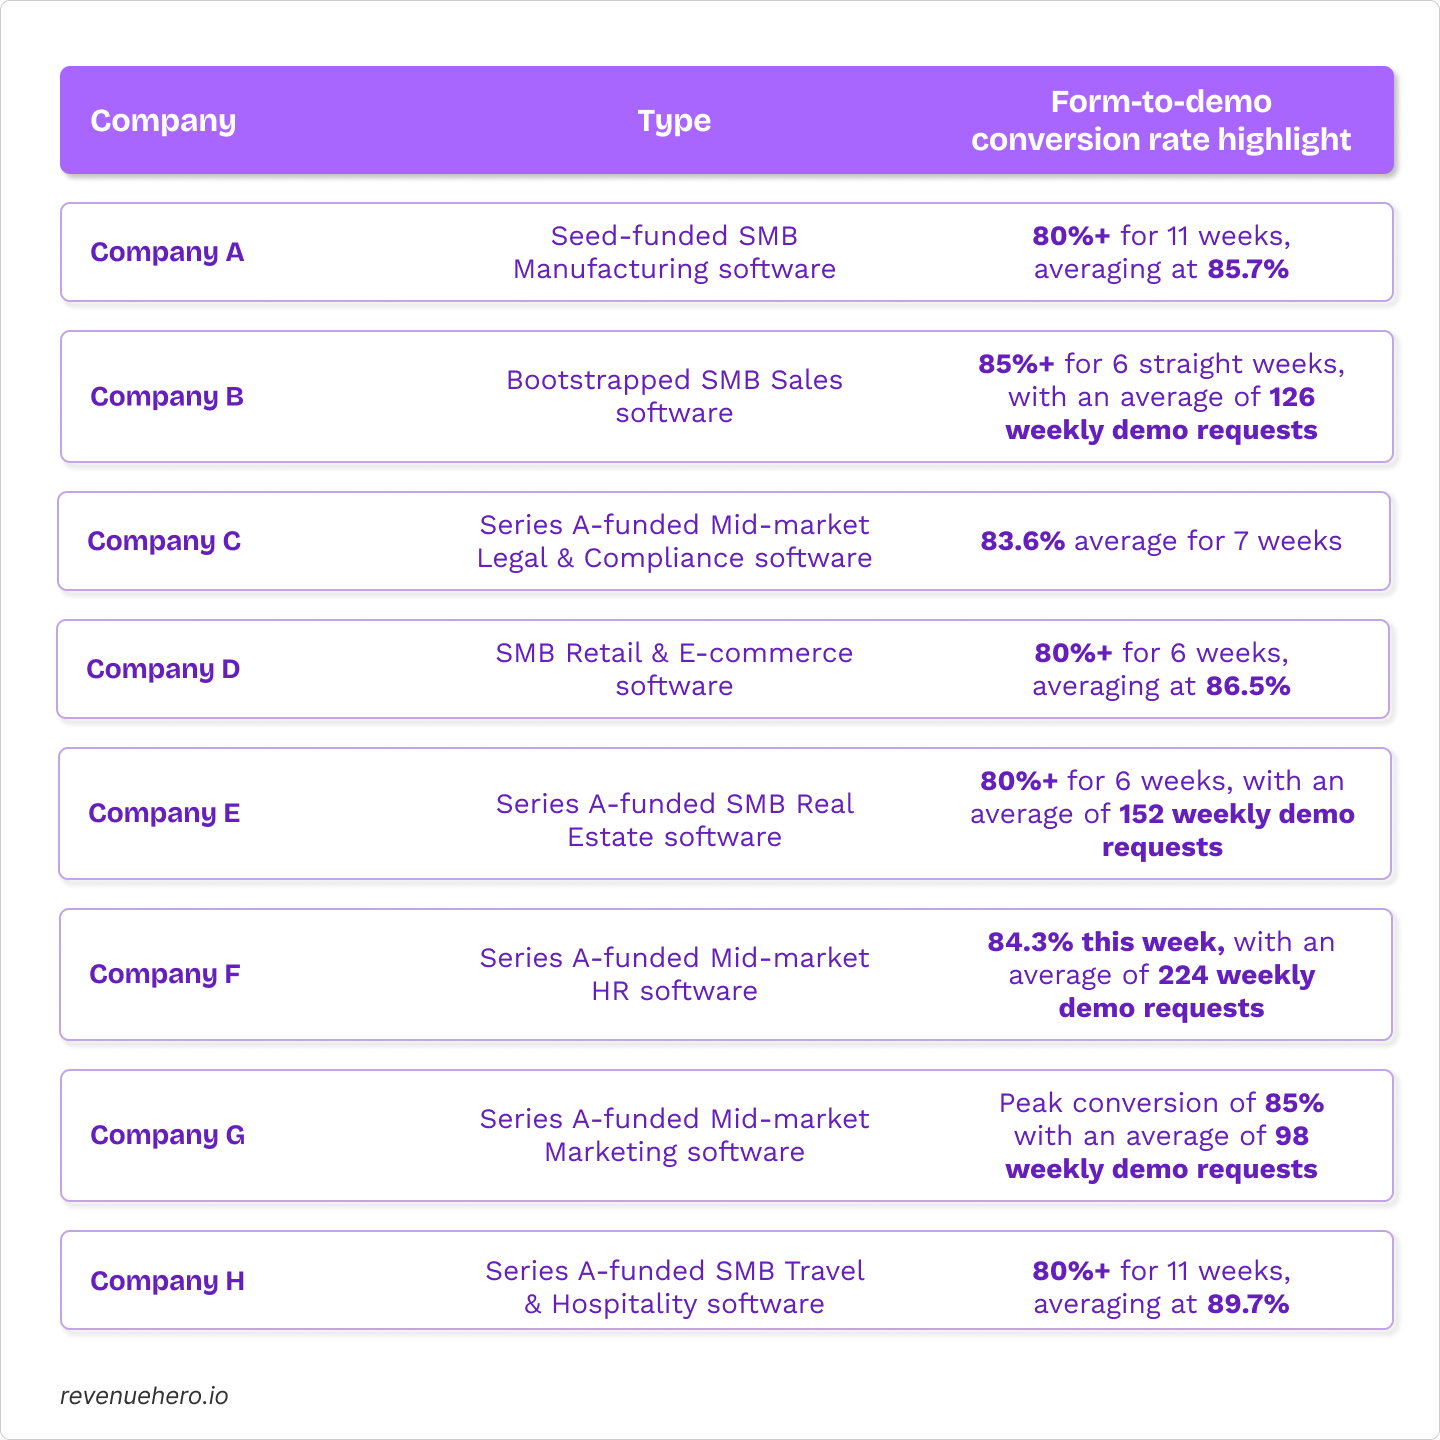
Eight companies across different industries, all converting above 80% repeatedly—even while their industries fluctuated around them.
There were four distinct patterns that kept showing up on their demo pages ⬇️
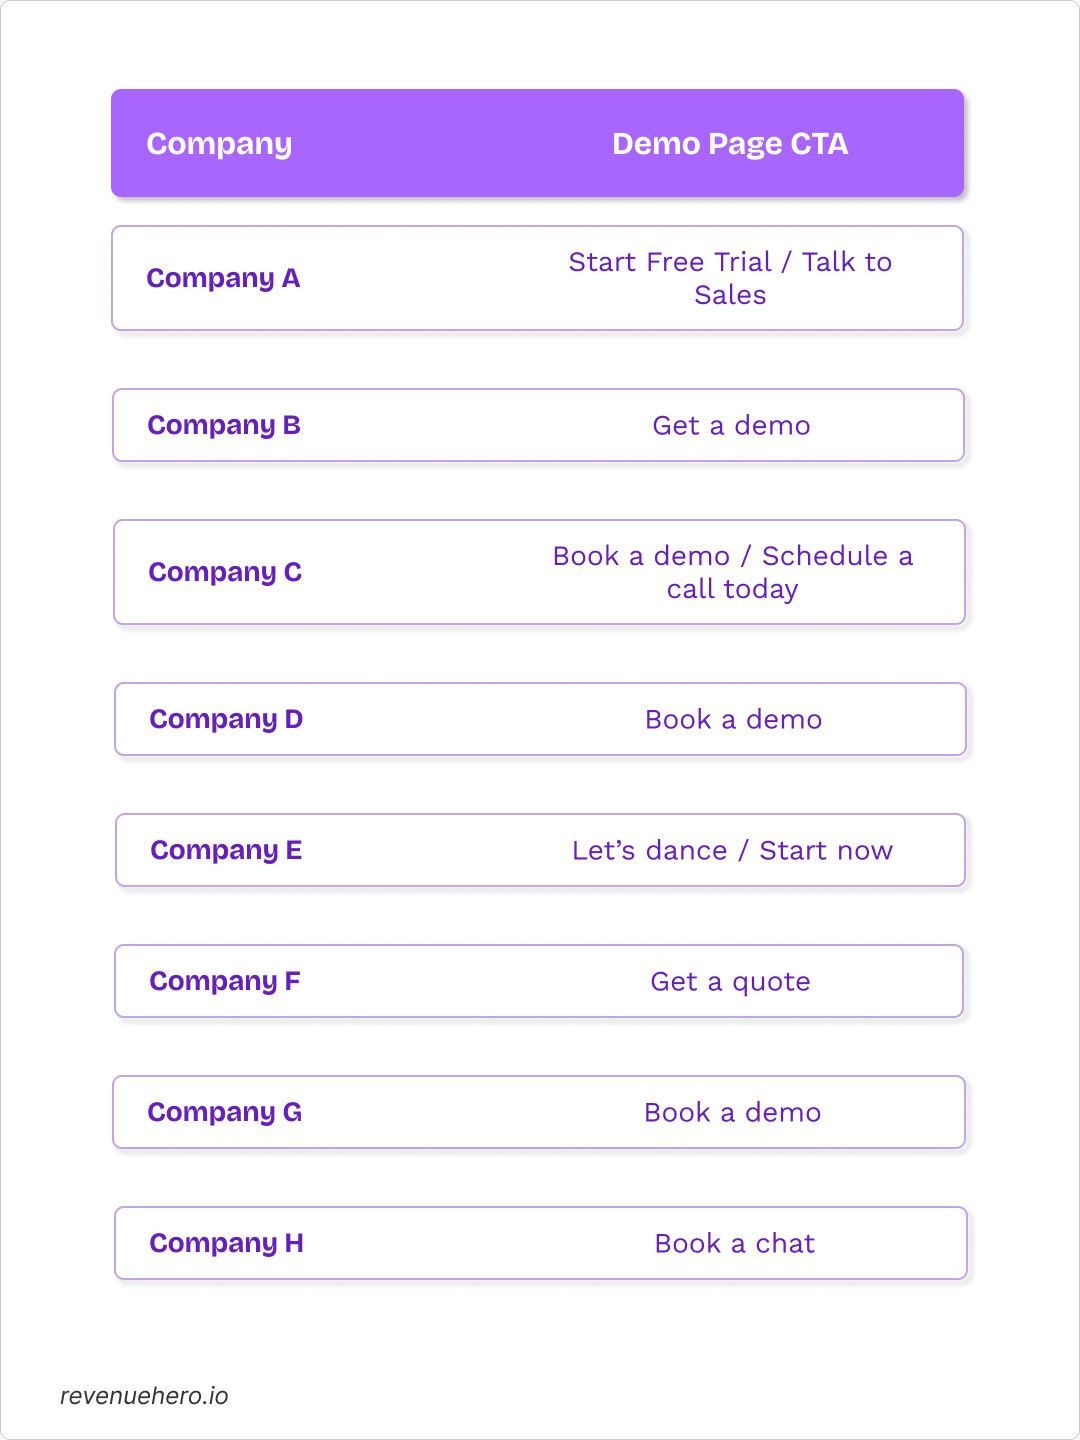
Pattern 1: None of their CTA says “Request”
This pattern mirrors what we found during our analysis of 1M+ form submissions: action words like Get, Book, or Schedule outperform Request by 5-6%. The difference is simple, yet subtle: “Request” implies a queue, “Book” or “Get” implies a calendar.
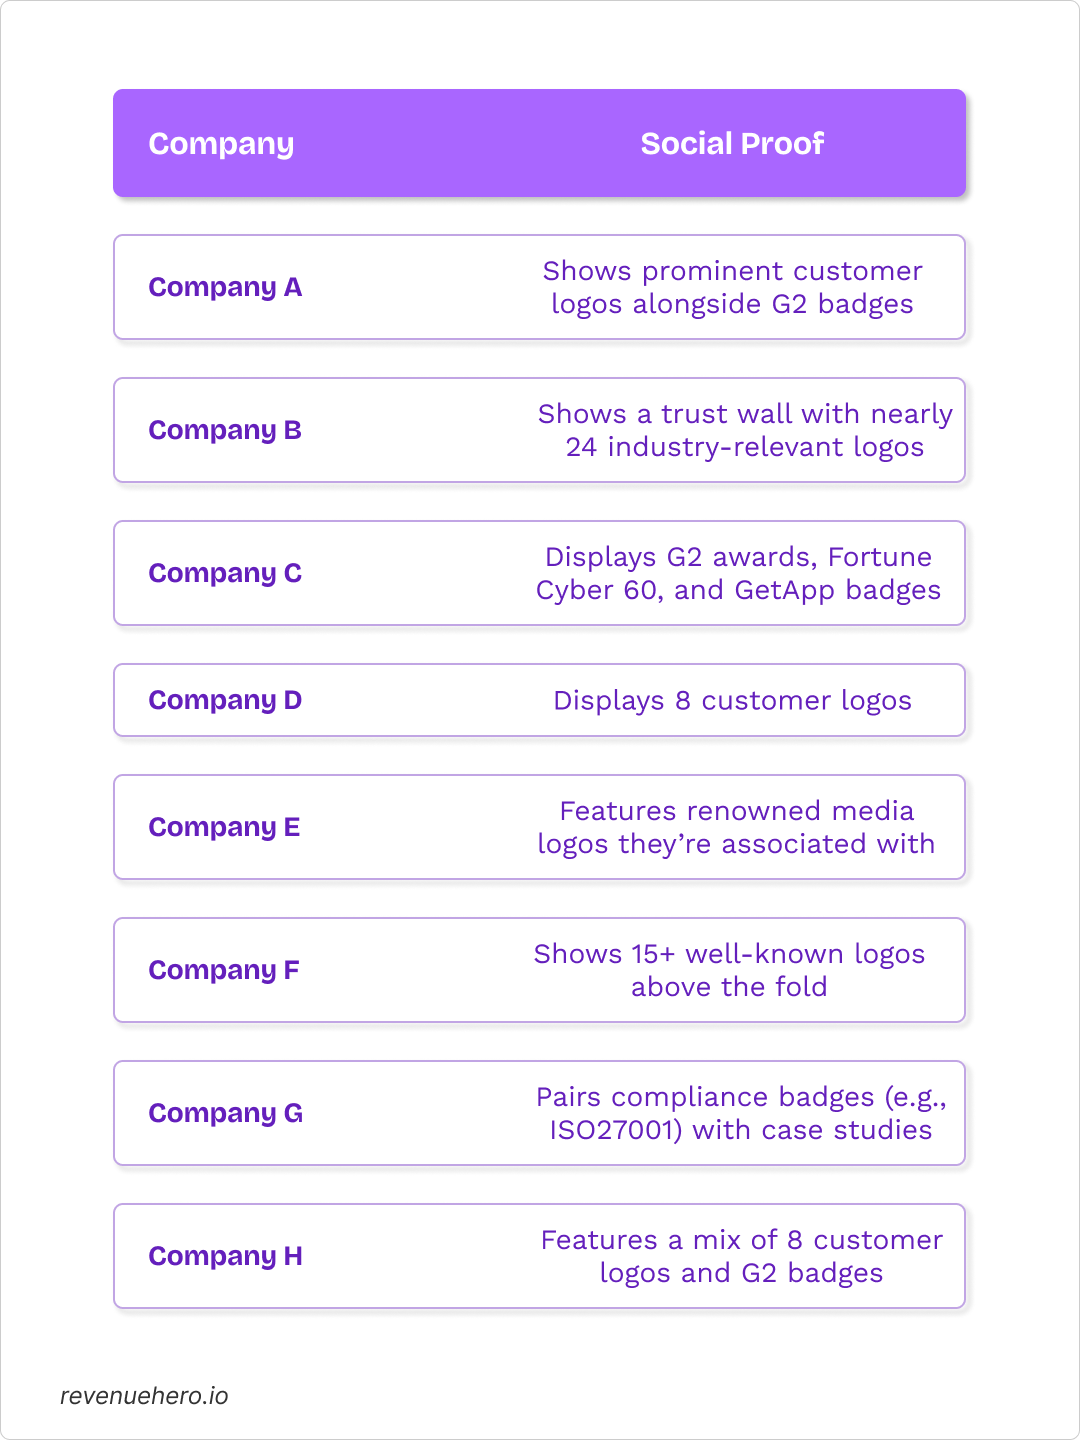
Pattern 2: Social proof before demo form
Our demo page benchmark analysis found that top-performing pages carry 6–12 customer logos, 5+ reviews with ratings, and 4–5 trust badges. These eight companies check every box:
Pattern 3: Testimonials carry results, not just praise
These demo pages steer clear of generic praises. Instead, they double down on specific results:
- Company D’s testimonials read like mini case studies
- Company F’s reviews include the reviewer’s job title and cite industry-relevant metrics
- Company C features named testimonials with specific compliance outcomes
- Company G’s case studies show increased conversion rates, hours saved, data-processing improvements with exact numbers
Pattern 4: The path from demo form to calendar is short
All these companies embed RevenueHero’s scheduling widget directly on the page. Qualified visitors see available time slots for a meeting without having to leave the demo page. Some of them segment visitors by company stage, size, or job titles—to route them to the right flow immediately.
There’s another common thread among these companies: they don’t make you fill out a form and wait for an email. The calendar is right there.
These four patterns: action CTAs, trust-before-form, metric-driven testimonials, and minimal friction to calendar; aren’t coincidental. They’re the same patterns we identified across the 50 top-performing demo pages.
It’s clear: these eight companies are executing the playbook that has proved converting 80%+ of their qualified inbounds week over week.
Onto the regular weekly numbers now ⬇️
Weekly Highlights ✨
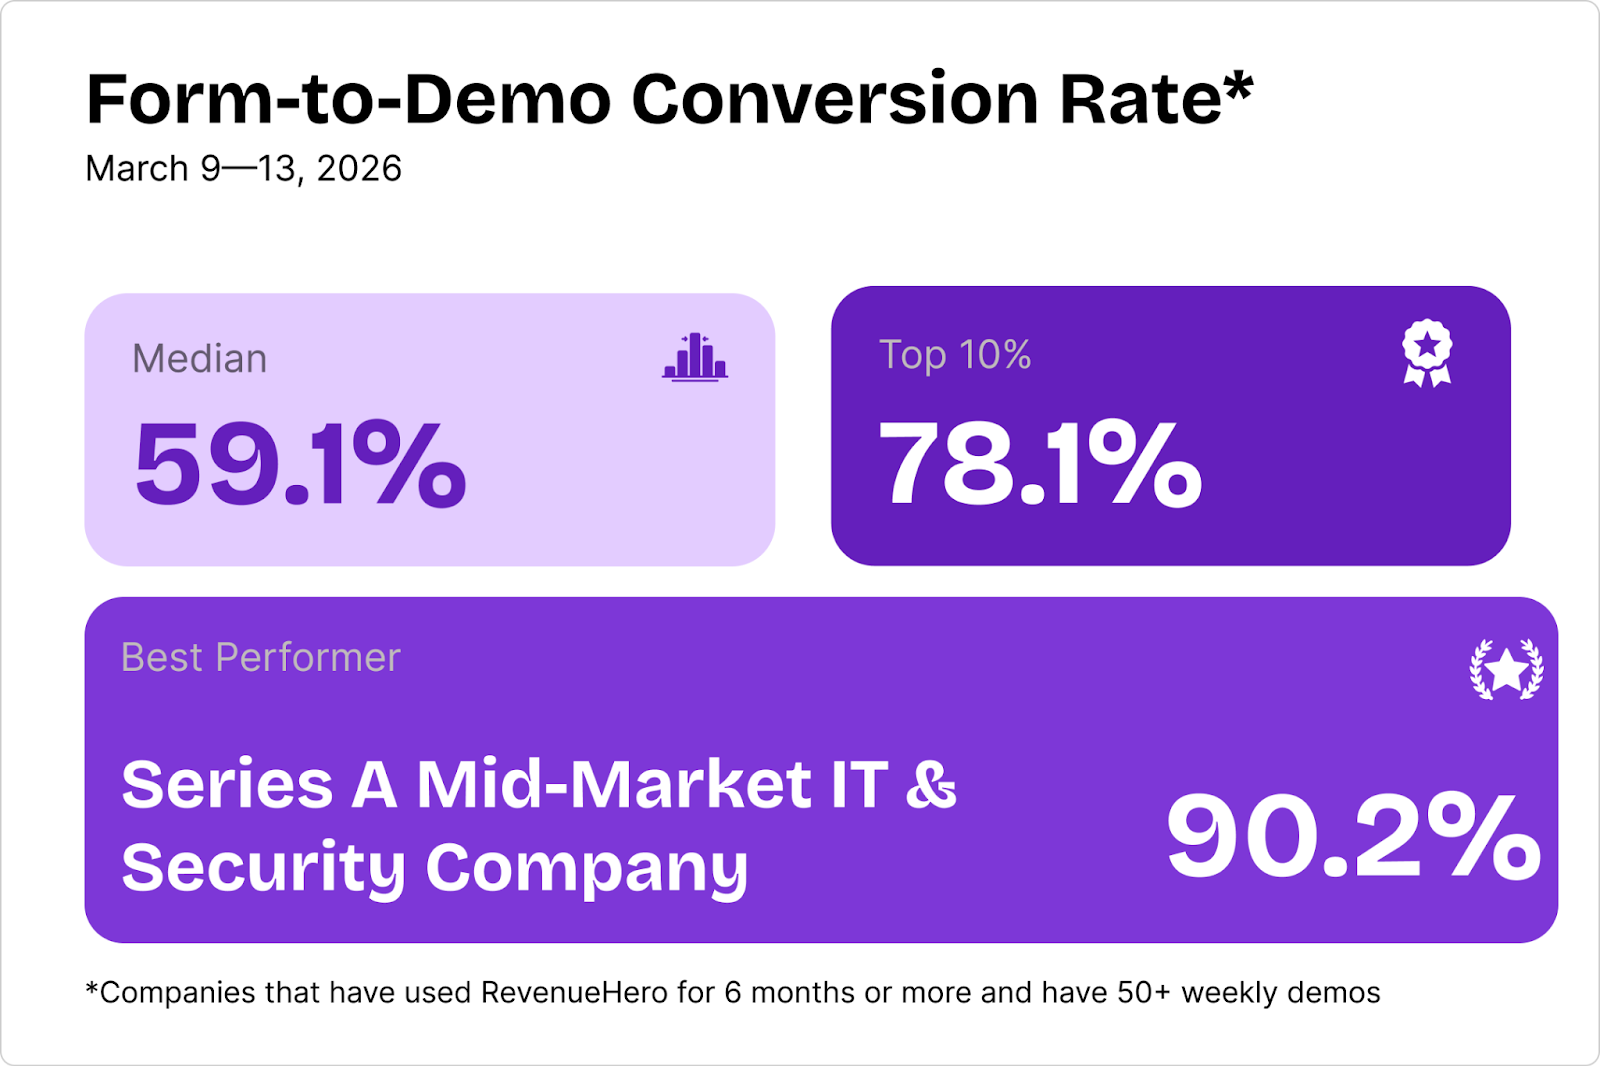
The best performer last week was a Series A funded Mid-market IT & Security software company. Here’s what we learnt from their demo page:
- They use “Get a demo” as their CTA
- They have displayed 6 customer testimonials with ratings and company logos
- They have displayed 8 customer logos
- Their demo form has 7 fields, with 3 qualifier fields
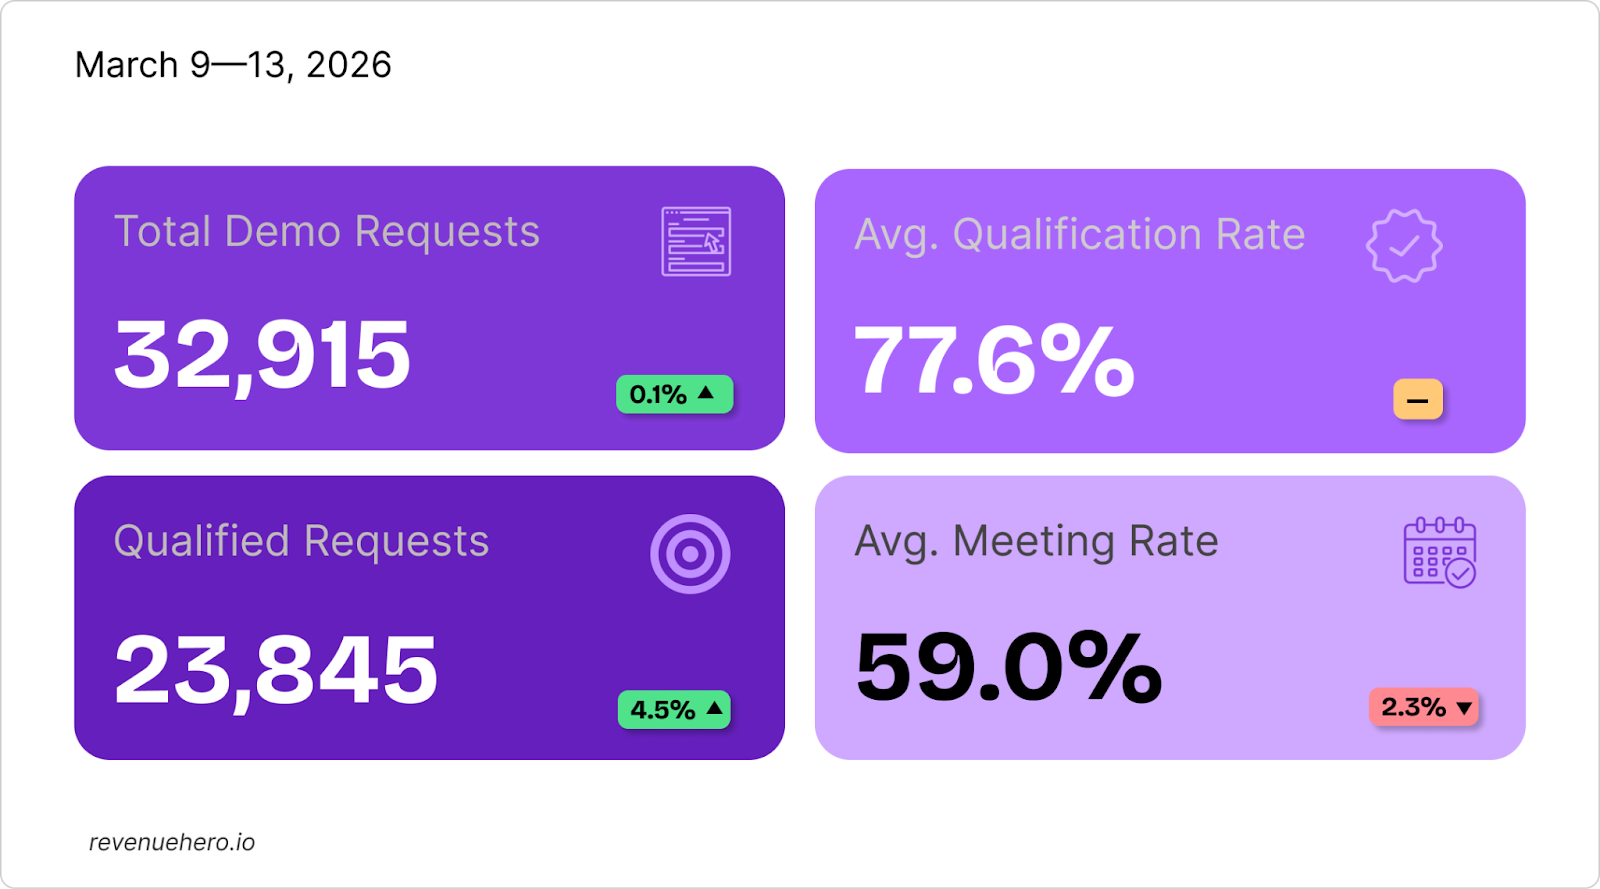
Inbound Snapshot
While more people qualified last week, fewer of them converted. The top of the funnel widened, while the bottom got pickier. Demo request volumes and qualification rates held flat, while meeting rates slipped 2.3% to 59.0%.
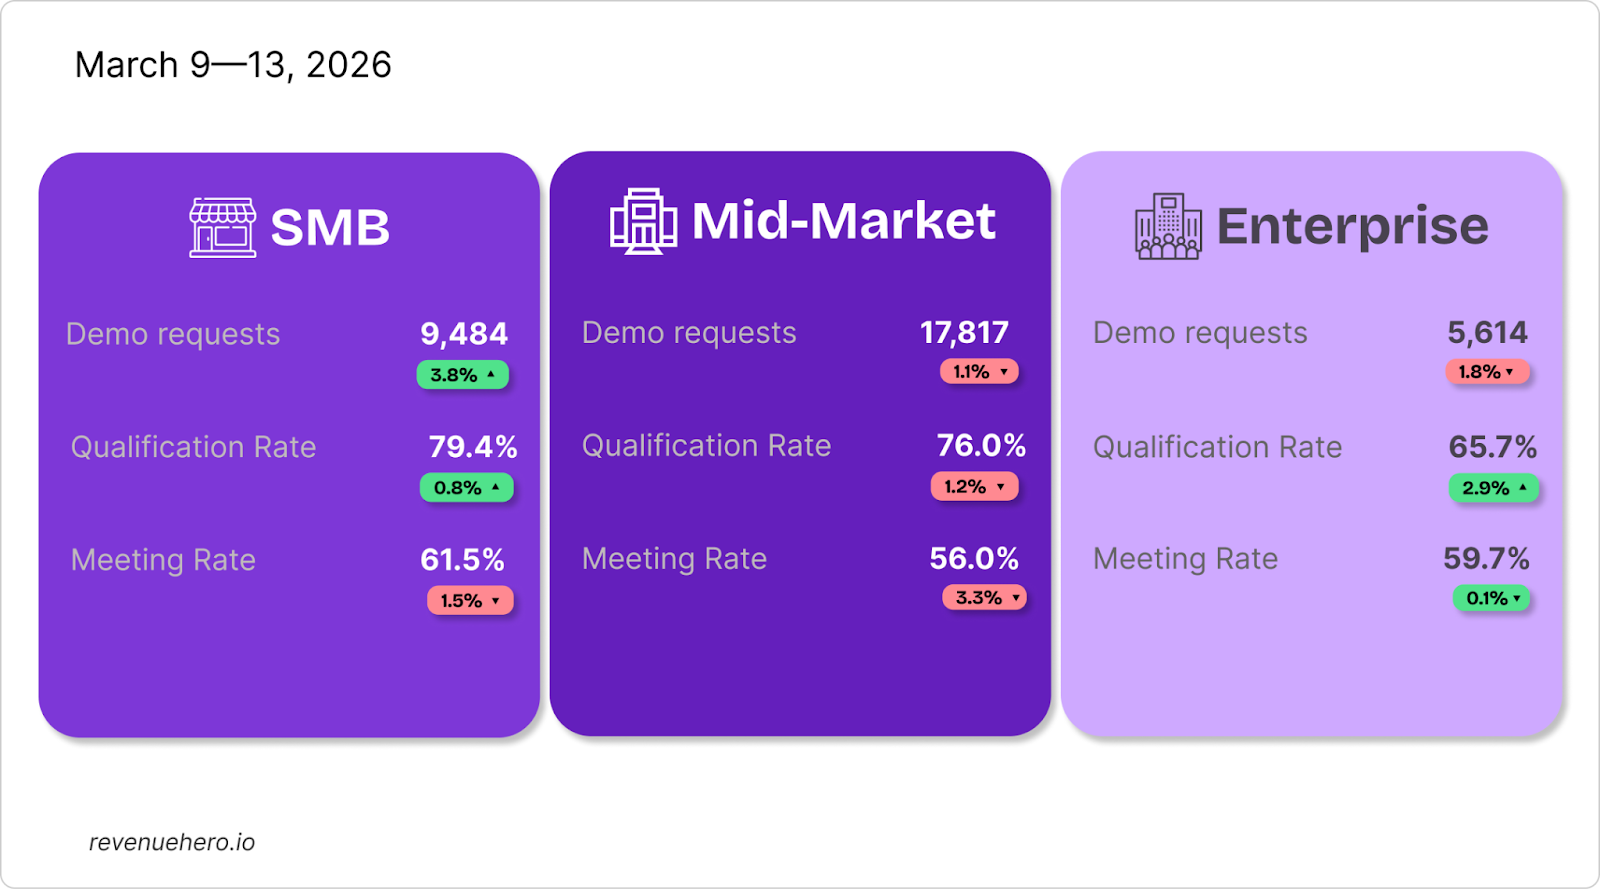
Segment Snapshot
SMB saw a 3.8% growth in demo requests. While qualification rates nudged up 0.8%, form-to-demo conversion rates slipped 1.5%.
Mid-market companies took the biggest efficiency hit: demo requests dipped 1.1%, qualification rates were down 1.2%, and meeting rates declined 3.3% to 56%. If you fall in this category, start with your demo form: check if each field is necessary or if it’s increasing friction.
Enterprise remained remarkably steady with a slight dip in demo request volumes, but steady form-to-demo conversion rates and a 3% rise in qualification rates.
Funding Stage Analysis
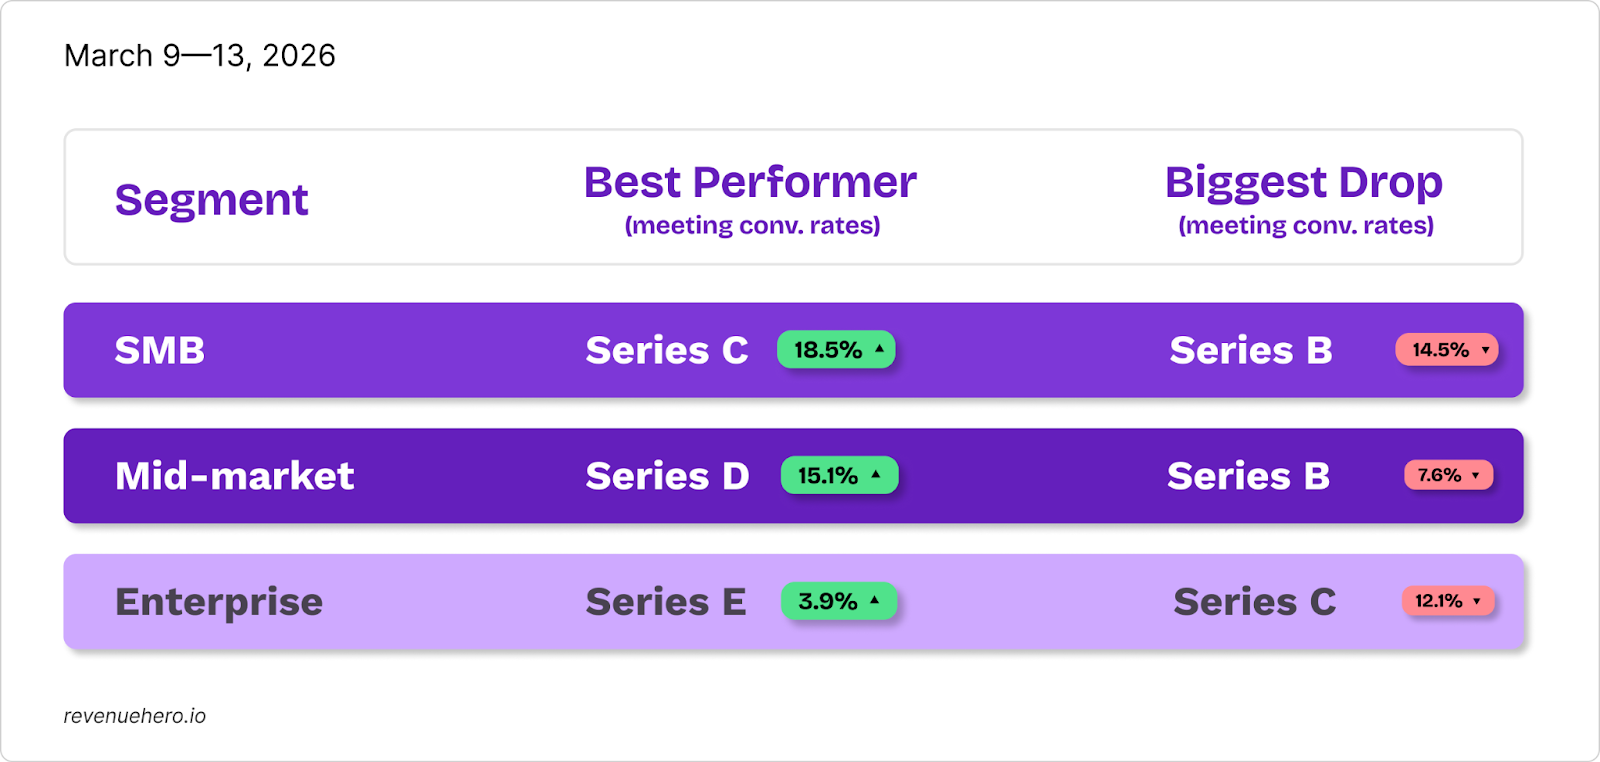
SMB Series C catapulted 18.5% in form-to-demo conversions, from 60.9% to 79.4% last week. Mid-market Series D soared 15.1%, a dramatic rebound from last week’s 51.2%.
On the other end of the spectrum, SMB Series B plummeted 14.5%, falling to 55.8%, whereas Enterprise Series C saw a steep fall of 12.1%. If you fall in either of these two cohorts, it’s time to audit your demo page.
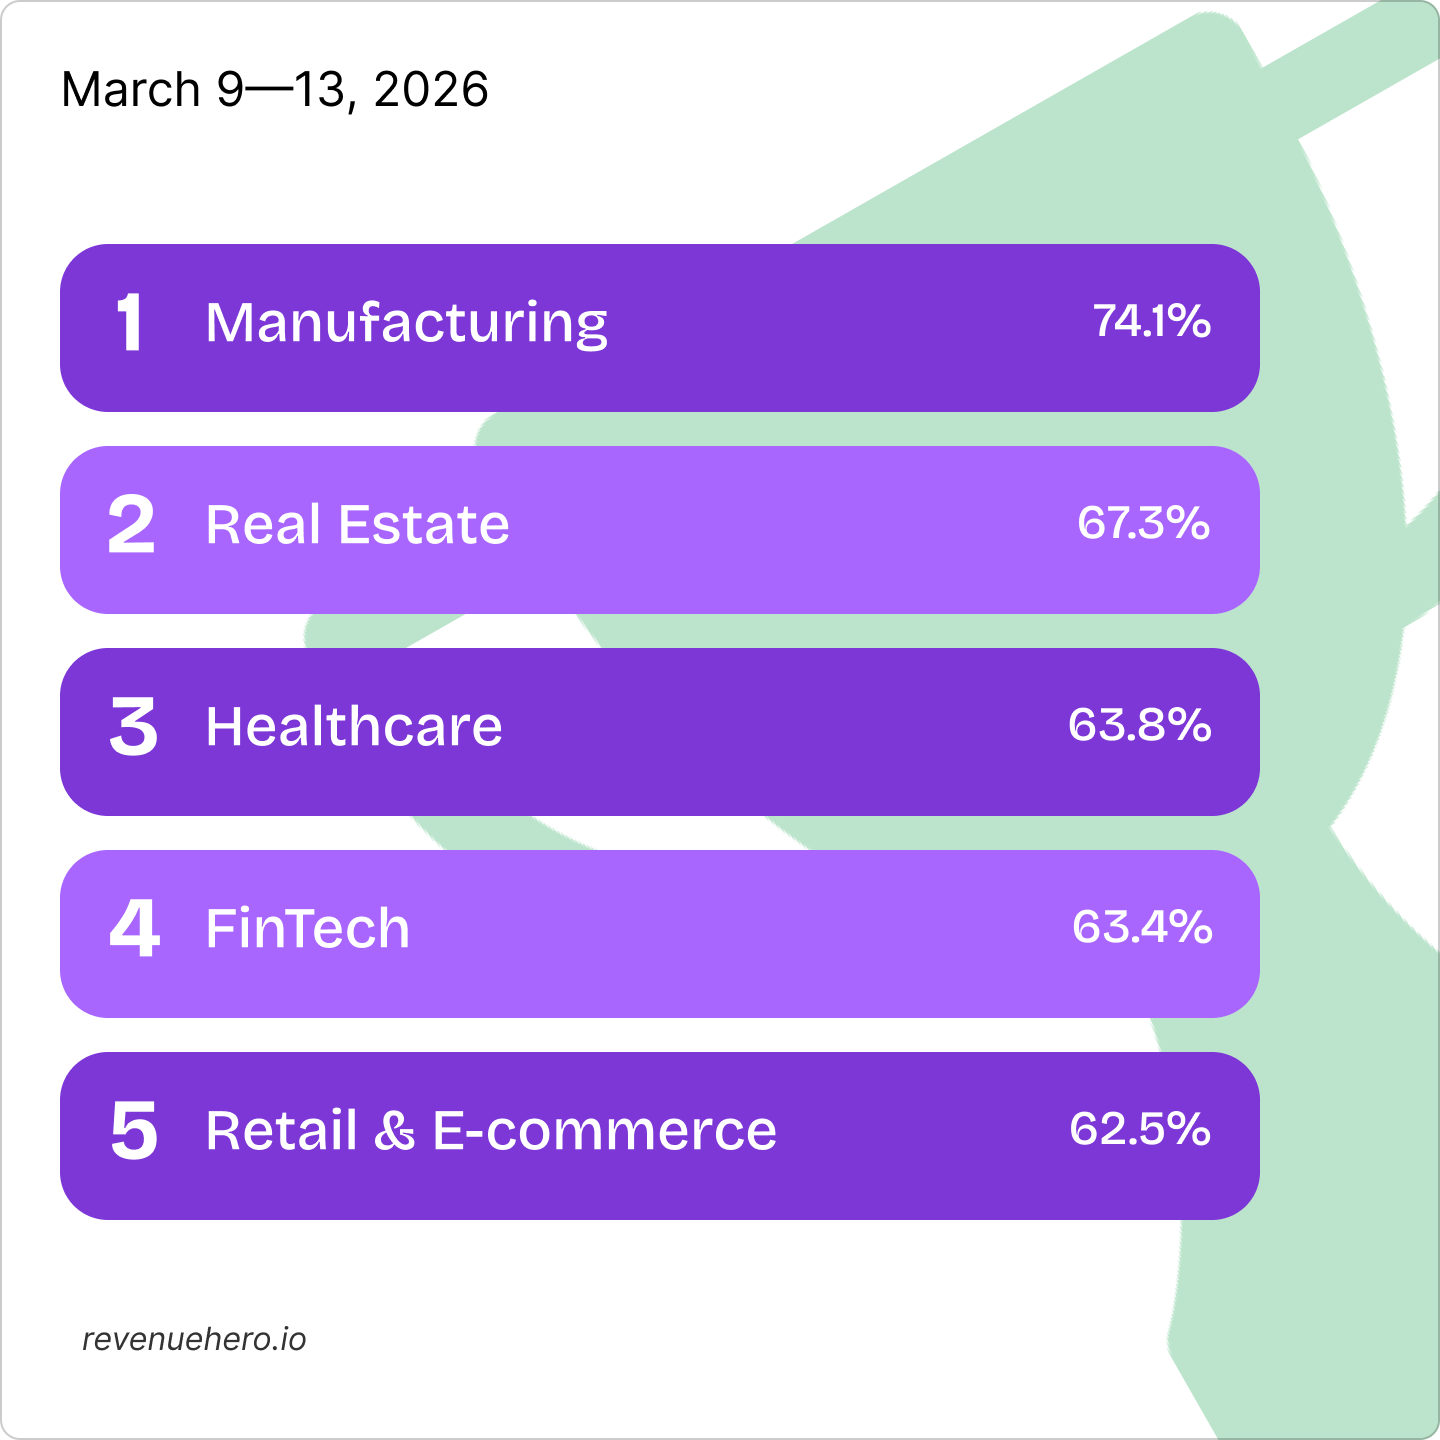
Industry-wise Meeting Rates
Manufacturing skyrocketed 17.3% to 74.1%, reclaiming the #1 spot for the second time in 14 weeks. Real estate slid 7.2% from last week, but retained the second position.
Legal & compliance had the hardest fall of 18.2%, dropping from #1 in the previous week to #12 last week. Support dropped 9.6% to the second lowest form-to-demo conversion rate of 45.4%.
Except for developer tools & support, all industries converted 50%+ of their qualified inbounds into booked meetings. However, only 20% saw steady or better conversion rates.
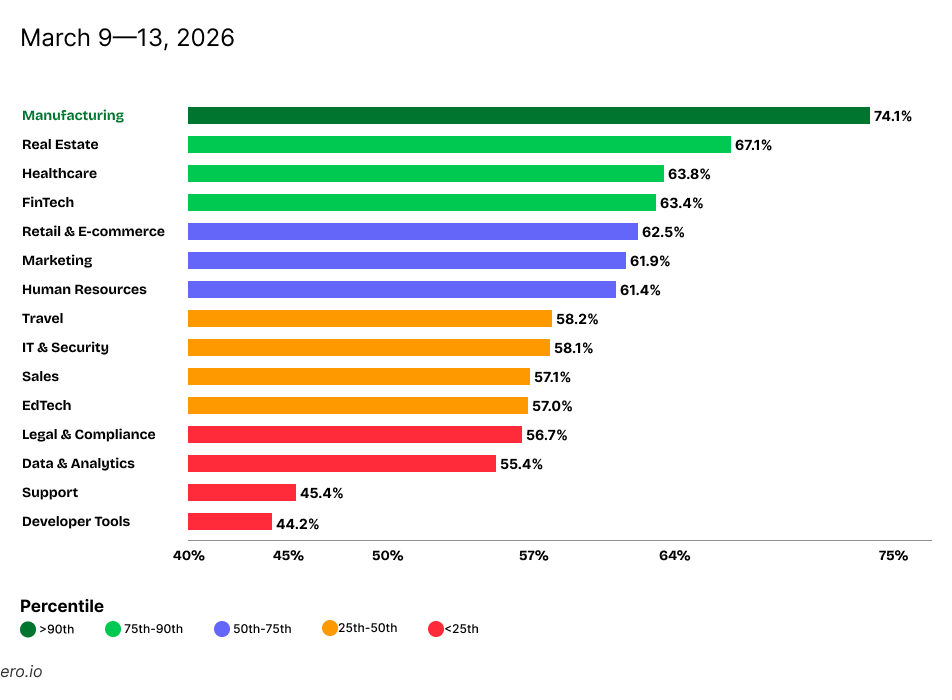
Top Performers
Manufacturing claimed the top spot this week at 74.1%, while real estate followed behind at a 7 percent gap. Healthcare completed the podium, with an average conversion rate of 63.8%.
Key Observations
- Demo volume held flat at 32,915 (+0.1%), but meeting rates slipped -2.3% to 59.0%. More qualification, less conversion implies a booking-speed signal, not a demand problem.
- SMB was the only segment with volume growth (+3.8%), but meeting rates slipped -1.5% to 61.5%.
- Mid-Market had the toughest week: meeting rates declined -3.3% to 56.0%, the lowest of the three segments.
- Manufacturing catapulted from #12 to #1 with a +17.3% surge to 74.1%, the only industry above 70% this week.
- Healthcare's four-week streak above 70% ended at 63.8% (-8.0%). Support crashed to the bottom at 45.4%.
- Biggest wins: Manufacturing (17.3%), EdTech (7.0%)
- Biggest drops: Legal & Compliance (-18.2%), Support (-9.6%), and Healthcare (-8.0%).
- SMB Series C catapulted +18.5% to 79.4%, the biggest funding stage spike.
We'll be back next week with a fresh batch ✨
Until then, keep those meetings flowing 📈


