Most B2B SaaS teams assume a 35-40% qualified-to-booked rate is normal. That assumption is costing them pipeline. Data from over one million inbound form submissions tells a different story: the median conversion rate across B2B SaaS companies using instant scheduling sits at 62%, and the top 10% exceed 78%. The gap between what most teams accept and what's actually achievable isn't explained by better leads or bigger budgets. It's explained by what happens in the 30 seconds after someone fills out a form. If you're benchmarking your funnel against outdated numbers, you're measuring against the wrong standard. Understanding lead-to-meeting conversion benchmarks by industry gives you a real target, not a comfortable one. The question isn't whether your numbers are "okay." It's how much pipeline you're leaving behind.
The Shift in Lead-to-Meeting Conversion Standards
Why the 35% Conversion Benchmark is Outdated
The 35% qualified-to-booked benchmark comes from a world where manual review queues, SDR triage, and back-and-forth email scheduling were standard practice. A lead would fill out a form, land in a queue, wait for someone to review it, and maybe receive an email 24-48 hours later. Intent decayed at every step. That number was never a standard to aspire to; it was a symptom of broken process.
Companies that have automated the handoff between form fill and calendar booking have proven that 60%, 70%, and even 80%+ is achievable. The best performer in the dataset hit 88%. These aren't cherry-picked case studies. They're aggregate numbers from B2B SaaS companies, weighted by volume, across a full calendar year. If your team is still treating 35-40% as a reasonable target, the data says you're operating with a structural disadvantage.
The Impact of Instant Scheduling on Pipeline Velocity
The intent decay curve is steep. A lead that sees a calendar immediately after qualifying has roughly an 80% probability of booking. Wait until the next day, and that drops to around 40%. The companies in the top decile of this dataset made a specific choice: they stopped treating inbound scheduling as an afterthought and started treating it as the conversion event itself.
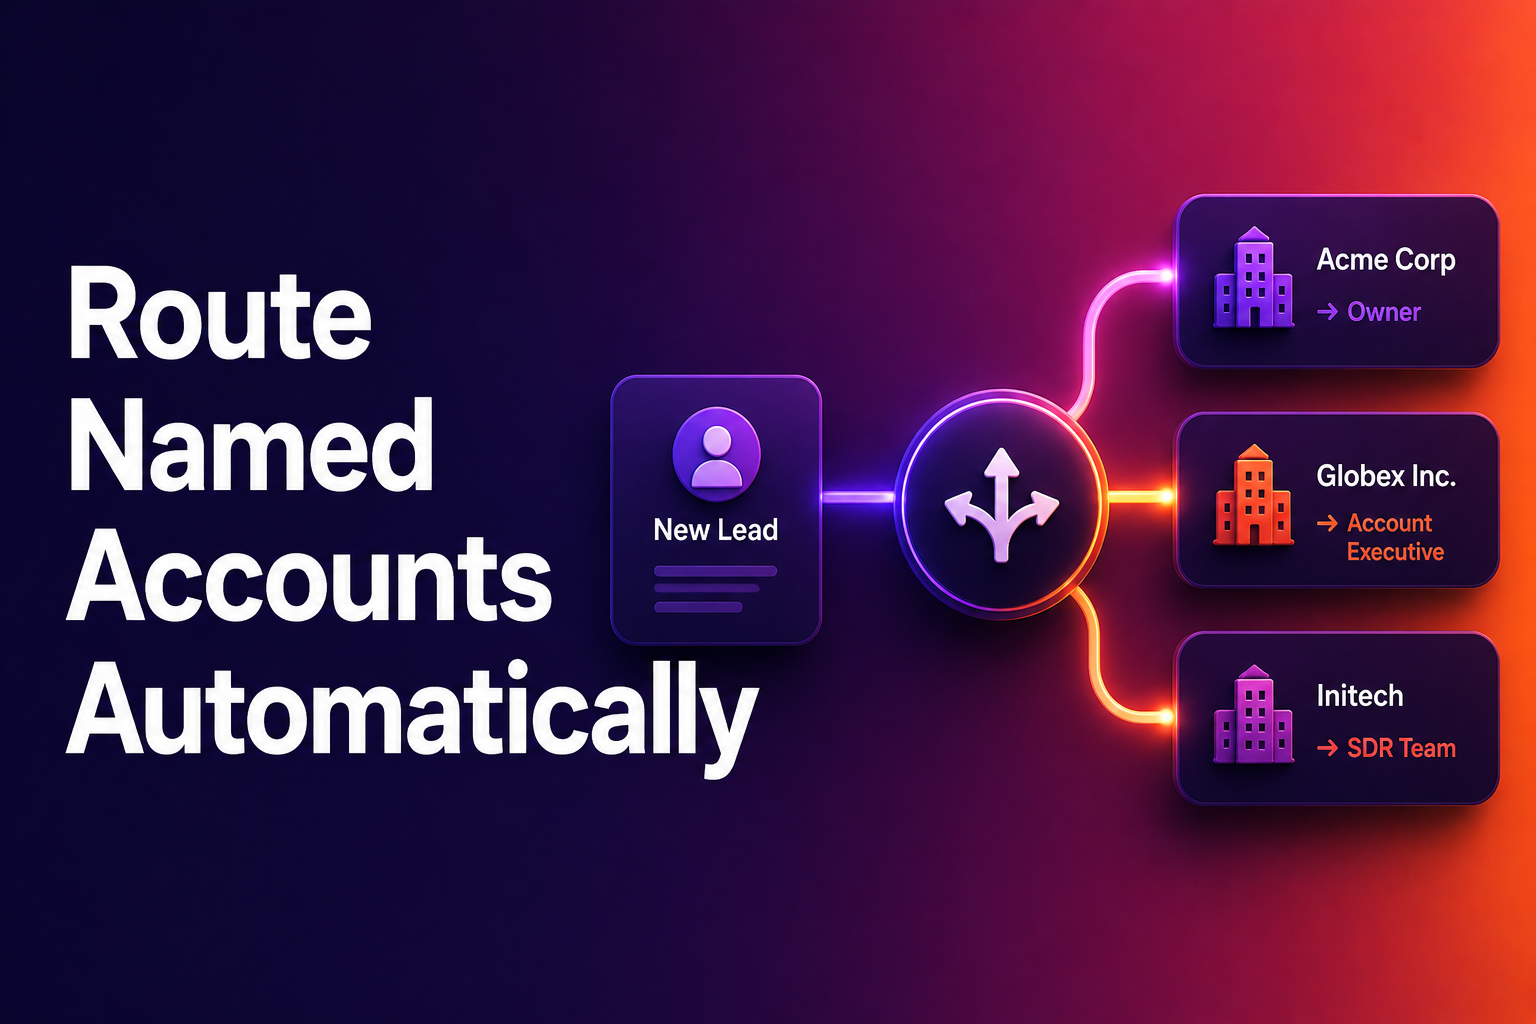
No waiting for an SDR to review the lead. No "thanks, we'll be in touch" confirmation pages. The form submission triggers real-time qualification using form responses, enrichment data, and CRM history. If the lead qualifies, they see a calendar on the same page. This is the infrastructure that separates a 62% median from a 78%+ top-performer rate. RevenueHero customers, for example, skip the manual review queue entirely, qualifying and routing leads to the right rep's calendar in seconds. Pipeline velocity isn't about working leads faster. It's about eliminating the gap between intent and action.
Industry Benchmarks: Who Leads the Pack?
Vertical SaaS vs. Horizontal SaaS Performance
One pattern stands out across the entire dataset: vertical SaaS consistently outperforms horizontal SaaS. Construction Tech leads at 69.1%. Ecommerce hits 68.8%. Travel Tech comes in at 68.3%. Compare that to generic Sales Tech at 62.8% or Dev Tools at 55%.
The advantage comes from clarity. When you sell to contractors, "Are you a contractor?" is a simple, effective qualification question. When you sell to "any company that does marketing," qualification gets fuzzy. Visitors aren't sure if they're the right fit. Reps aren't sure how to personalize the demo. Everything downstream suffers. If you're a horizontal product, consider vertical positioning on your landing pages. A "Marketing software for e-commerce" page will convert better than a generic "Marketing software" page, even if the product is identical. Specificity signals fit, builds confidence, and drives conversion.
Top Performing Categories: Construction, Ecommerce, and Real Estate Tech
The data breaks down qualified-to-booked meeting rates by category and percentile. Here are the standouts:
- Construction Tech: 70% median, 78% at the top 10th percentile
- Real Estate Tech: 66% median, 83% at the top 10th percentile
- Ecommerce: 66% median, 80% at the top 10th percentile
Real Estate Tech is particularly interesting. Its median is solid but not exceptional, yet its top performers hit 83%, the highest of any category. That spread suggests a massive opportunity gap within the vertical. The companies that get the post-form experience right dramatically outperform their peers. EdTech (65% median), Supply Chain and Logistics (64%), and IT Services (66%) also perform well, while Security and Compliance (60%) and Data and Analytics (55%) lag behind.
Analyzing the Data Gap: Median vs. Top 10% Percentile
Across all categories, the gap between median and top 10% performance is roughly 16 percentage points. That's not a rounding error. On the same traffic and the same spend, top performers are booking 16% more meetings from qualified leads. For a company generating 500 qualified leads per month, that's 80 additional meetings, purely from post-form execution.
The bottom 25% of companies convert at just 53%. The top 25% hit 72%. This distribution tells you that the problem isn't lead quality or market conditions. It's operational. The 30 seconds after the form fill determine which side of the median you land on. Dev Tools shows the tightest range (55% median, 67% top 10%), while Real Estate Tech shows the widest (66% median, 83% top 10%). Categories with wider spreads represent the biggest improvement opportunities.
Conversion Variations by Company Segment and Funding Stage
The 'Middle-Stage Slump' in Series A and B Companies
A surprising pattern emerges in the data: both early-stage and late-stage companies outperform the middle. Unfunded and seed-stage companies convert at 63.6%. Series D and PE-backed companies convert at 66.8%. But Series A companies drop to 53.6%, and Series B sits at 55.3%.
Why the slump? Early-stage companies tend to have tight positioning and founder-led sales with fast response times. Late-stage companies have invested in operations, routing logic, and automation. Series A and B companies are caught in between: they've outgrown the founder-led model but haven't yet built the operational infrastructure to replace it. They're adding SDRs, building review queues, and introducing manual handoffs that slow everything down. The irony is that the stage where companies invest most aggressively in lead generation is also the stage where they convert those leads least efficiently.
Enterprise vs. SMB Qualified-to-Booked Rates
Enterprise-focused companies convert at 70.1% with a 71.2% disqualification rate. SMB-focused companies convert at 63.2% with a 21.8% disqualification rate. Mid-market sits at 61.2% with a 28.1% DQ rate.
The enterprise number looks counterintuitive until you factor in the DQ rate. Enterprise teams disqualify aggressively, filtering out over 70% of submissions. The leads that make it through are high-intent and well-matched, so the booking rate is high. SMB teams let more leads through, which means reps spend time on lower-quality conversations. The takeaway isn't that enterprise is "better." It's that tight qualification paired with instant scheduling produces the highest conversion rates. If your DQ rate is under 20% and your meeting rate is struggling, you're likely letting through leads that waste rep time. Tightening criteria on company size, industry, or use case fit can actually improve your booked meeting count.
Strategies to Bridge the Gap from Median to Top Performer
Optimizing Post-Form Experience within 30 Seconds
The gap between 40% and 78% on the same traffic is determined by what happens immediately after the form fill. Top performers treat the post-form experience as the most critical moment in their funnel. The lead has just expressed intent. They're on the page, engaged, and ready.
The highest-performing companies show a calendar immediately upon qualification. No redirect to a thank-you page. No promise of a follow-up email. The scheduling happens on the same page, in the same session. This eliminates the single biggest source of drop-off in the inbound funnel: the gap between "I want to talk" and "I'm scheduled to talk." If your current flow involves any manual step between form submission and calendar display, that's your highest-priority fix. Every second of delay costs you meetings.
Balancing Disqualification Rates and Friction
The question every RevOps team should ask about their qualification criteria: "Is this filtering out genuinely poor fits, or just adding friction?" The data shows that top performers convert at 77% with 2 form fields and at 76% with 13 fields. The number of fields doesn't matter. What matters is whether each field serves a purpose.
If a field helps you route to the right rep or disqualify a bad fit, keep it. If it exists because "we've always asked that," remove it. Review your DQ criteria quarterly. Construction Tech converts at 69.1% with tight vertical qualification. Generic horizontal products with loose criteria convert at lower rates despite similar traffic quality. The lesson: be deliberate about who you let through and who you filter out, then make the path to a meeting instant for everyone who qualifies.
Leveraging Specificity and Social Proof for Higher Intent
Top-performing companies do two things differently on their demo request pages: they position for a specific audience, and they use social proof with real numbers. A testimonial that says "We saw a 57% increase in bookings within 90 days" gives prospects a concrete expectation. It also implies you have customers willing to share real results, which is its own form of credibility.
Generic praise doesn't move conversion rates. Specific metrics do. If you're going to invest in social proof, invest in getting actual numbers from your best customers. Call them this week. Ask for one sentence with a metric. Put the strongest one on your demo page, above the fold, near the form. One testimonial with a number outperforms ten without.
Vertical positioning amplifies this effect. A landing page that says "Scheduling software for construction companies" with a testimonial from a construction company CEO creates a specificity loop. The visitor sees themselves in the page, trusts the social proof, and converts at a higher rate. The data backs this up consistently across every category in the benchmark.
Your conversion benchmarks by industry aren't just numbers to track. They're a diagnostic tool. If you're a Construction Tech company converting at 55%, you know you're underperforming your category median of 70%. If you're a Series A company at 53%, you know the middle-stage slump is real and fixable. The path from median to top performer isn't about generating more leads. It's about fixing the 30 seconds after the form fill, tightening your qualification logic, and positioning with enough specificity that the right buyers self-select. Measure against the right benchmarks, and the gaps become obvious. Close those gaps, and pipeline follows.
Let RevenueHero help your team turn high-intent users into booked meeting without slowing down your funnel.