Most B2B SaaS teams assume a 30-40% qualified-to-booked meeting rate is normal. That assumption is costing them pipeline every single day. An analysis of over one million inbound form submissions across 12 months of data from RevenueHero customers tells a different story: the median qualified-to-booked rate is 62%, the top 10% hit 78% or higher, and the best performers reach 88%. The difference between 40% and 78% on the same traffic, the same spend, and the same leads comes down to what happens in the 30 seconds after a form fill. Understanding lead-to-meeting conversion benchmarks by industry gives you a clear target and, more importantly, reveals where your funnel is leaking. If your team is leaving meetings on the table, the fix isn't more budget. It's less friction.
The Decay of Inbound Intent: Why Traditional Lead Handoffs Fail
The standard inbound process at most companies has a structural problem baked into it. A lead fills out a form. That form goes to a queue. Someone manually reviews it, maybe routes it, maybe emails the lead back. Days pass. Intent decays. The meeting that should have happened never does.
This isn't a people problem. It's a process problem. The traditional handoff between marketing and sales was designed for a world where buyers waited patiently. That world doesn't exist anymore. Buyers in 2026 are evaluating three or four vendors simultaneously, and the one who gets them on a call first has a massive advantage.
The 48-Hour Lag: How Manual Review Queues Kill Conversions
The old qualified-to-booked benchmark of 35% came from manual review queues and delayed follow-up. A lead submits a demo request on Tuesday afternoon. An SDR reviews it Wednesday morning. They send an email. The lead responds Thursday. A meeting gets booked for the following week, if it gets booked at all.
That 48-hour lag isn't just slow: it's destructive. Conversion probability drops from roughly 80% in the first minute to around 40% by the next day. The "five-minute rule" that sales teams once treated as gospel is already obsolete. Modern buyers expect sub-minute engagement, and anything slower than that feels like silence.
The Gap Between Form Fills and Booked Meetings
A form fill is an expression of intent. A booked meeting is a commitment. The gap between those two events is where most pipeline dies. Every "thanks, we'll be in touch" confirmation page is a conversion killer. Every round of back-and-forth email scheduling introduces another chance for the lead to go cold or choose a competitor.
The companies hitting 78%+ conversion rates have eliminated that gap entirely. They treat the moment of form submission as the conversion event, not the beginning of a follow-up sequence.
2025 Qualified-to-Booked Benchmarks: The New Standard
The data from this benchmark study resets expectations for what "good" looks like. These numbers aren't theoretical. They're drawn from real B2B SaaS companies using instant scheduling infrastructure across a full calendar year.
Median Performance vs. the Top 10% Elite
The median qualified-to-booked rate across all customers is 62%. The top 25% convert at 72%. The top 10% hit 78% or above, and the single best performer reached 88%. The bottom 25% still convert at 53%, which already exceeds the old "industry standard" that many teams still target.
The 16-percentage-point gap between median and top 10% represents real revenue. On a base of 1,000 qualified leads per quarter, that gap is 160 additional meetings. If your average deal size is $30,000 and your meeting-to-close rate is 20%, that's nearly $1 million in pipeline you're not creating.
Why 35% is No Longer the Industry Standard
The 35% benchmark came from a world of back-and-forth email scheduling and 48-hour response times. With instant scheduling, the floor is much higher. If your team is still using 35% as a target, you're benchmarking against a process that top-performing companies abandoned years ago.
The shift isn't gradual. Companies that move from manual handoffs to instant qualification and scheduling typically see conversion jumps of 30-50% within 90 days. The old number wasn't wrong for its era. It's just irrelevant now.
Industry-Specific Conversion Benchmarks
A single benchmark doesn't tell the whole story. Your conversion rate is shaped by your vertical, your buyer profile, and the specificity of your positioning. Here's how different categories perform.
Vertical SaaS Leaders: Construction, E-commerce, and Real Estate Tech
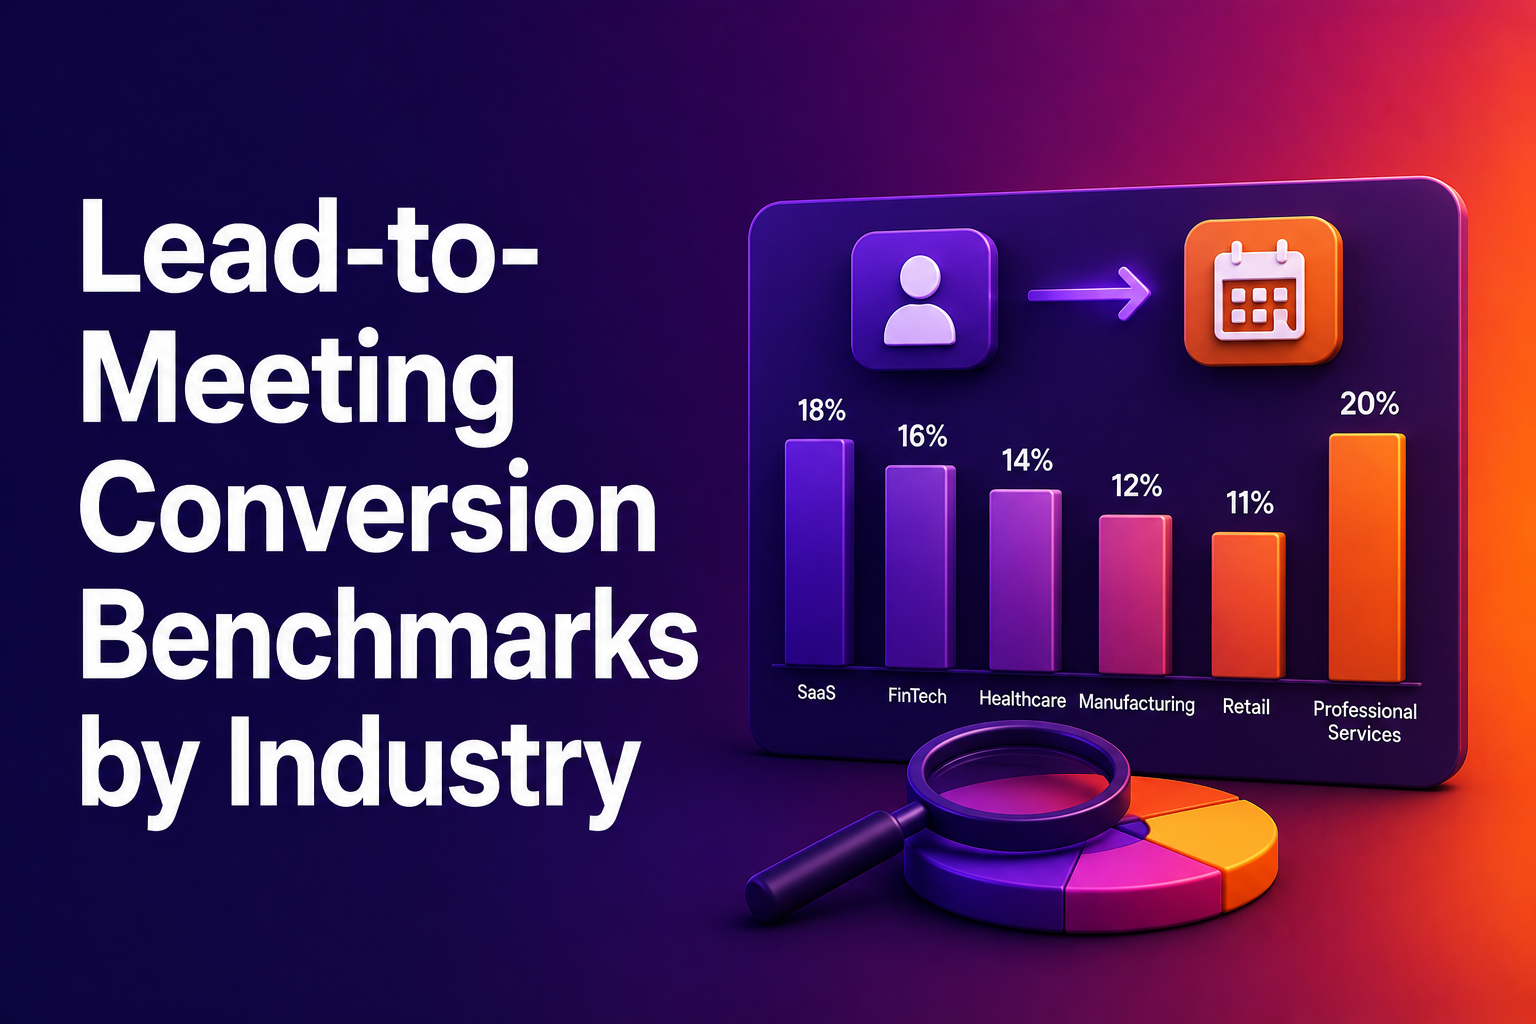
Vertical SaaS consistently outperforms horizontal SaaS across the entire dataset. Construction Tech leads at a median of 70%, with the top 10% hitting 78%. Real Estate Tech follows at 66% median, with top performers reaching 83%. E-commerce software companies convert at similar rates, with median performance around 68.8%.
The reason is straightforward. When you sell to contractors, "are you a contractor?" is an easy qualification question. The specificity of vertical software means visitors self-select more accurately, reps know exactly how to personalize the demo, and everything downstream gets easier. Qualification is cleaner, and the buyer feels confident they're in the right place.
Horizontal Software Challenges: MarTech, Sales Tech, and HR Tech
Horizontal categories face a harder qualification problem. MarTech sits at a 62% median, Sales Tech at 63%, and HR Tech at 62%. These aren't bad numbers, but they trail vertical leaders by 5-8 percentage points.
The challenge is that "any company that does marketing" is a broad target. Visitors aren't always sure they're the right fit. Reps aren't sure how to personalize the first call. The fuzziness of horizontal positioning creates friction at every stage, and that friction shows up directly in lower meeting rates.
Infrastructure and Security: Data, Dev Tools, and Compliance
Data and Analytics companies convert at a 55% median, Dev Tools at 55%, and Security and Compliance at 60%. These categories tend to have longer evaluation cycles and more technical buyers who may prefer self-serve exploration before committing to a meeting.
The top 10% in Security and Compliance still hit 74%, and Data and Analytics top performers reach 77%. The ceiling is high even in these categories, but reaching it requires tighter qualification and faster routing to technical sellers who can speak the buyer's language.
How Company Segment and Funding Stage Impact Conversion
Your company's size, target market, and funding stage all influence where you land on the conversion curve. These patterns are consistent across the dataset and worth understanding.
The 'Series A Slump': Why Middle-Stage Companies Struggle
There's a notable dip in the data: both early-stage and late-stage companies outperform the middle. Unfunded and seed-stage companies convert at 63.6%. Series D and PE-backed companies convert at 66.8%. But Series A companies sit at just 53.6%, and Series B at 55.3%.
The likely explanation is that early-stage companies have tight, focused positioning and a founder who personally qualifies every lead. Late-stage companies have built mature routing and qualification infrastructure. Series A and B companies are stuck in between: they've outgrown the founder-led model but haven't yet invested in the systems that replace it.
Enterprise vs. SMB: Disqualifying for Higher Quality
Enterprise-focused companies convert at 70.1%, significantly above the SMB rate of 63.2%. The difference isn't that enterprise leads are inherently better. It's that enterprise teams disqualify more aggressively: their DQ rate is 71.2%, compared to 21.8% for SMB teams.
By filtering out poor-fit leads before they reach the scheduling step, enterprise teams ensure that the leads who do qualify are highly likely to book. If your DQ rate is under 20% and your meeting rate is struggling, you might be letting through leads that waste rep time. Consider tightening criteria on company size, industry, or use case fit, and review those criteria quarterly.
Strategies to Bridge the Gap to 78%+ Conversion
Knowing the benchmarks is useful. Closing the gap to top-performer territory requires specific changes to your inbound process.
Treating Inbound Scheduling as the Primary Conversion Event
The companies in the top 10% made a clear choice: they stopped treating the form fill as the conversion event and started treating the booked meeting as the real milestone. Every CTA, form, and campaign link becomes a path to a calendar, not a "we'll be in touch" message.
This means qualification happens in real time, using form responses, enrichment data, and CRM history. No manual review queue. No delays. The moment someone submits, they know if they qualify, and qualified leads see a calendar immediately.
Vertical Positioning and Industry-Specific Social Proof
If you're a horizontal product, consider vertical positioning on your landing pages. A "Marketing software for e-commerce" page will convert better than a generic "Marketing software" page, even if the product is identical. The specificity signals fit, which builds confidence, which drives conversion.
Pair that with industry-specific social proof. A testimonial that says "we saw a 57% increase in bookings within 90 days" gives prospects a concrete expectation. One testimonial with a real number is worth ten without. Call your best customers this week. Ask for one sentence with a metric. Put the strongest one on your demo page, above the fold, near the form.
Real-Time Qualification and Instant Scheduling Infrastructure
The gap between 35% and 78% isn't about having better leads or a better product. It's about what happens in the 30 seconds after someone clicks "Book a Demo." Do they see a calendar, or do they see a confirmation page? Platforms like RevenueHero make this possible by qualifying leads instantly using firmographic data and enrichment, routing to the right rep based on territory, product interest, or existing CRM ownership, and presenting a calendar in the same interaction.
The infrastructure matters because it removes every manual step between intent and commitment. No SDR review queue. No email ping-pong. No 48-hour lag. The meeting books itself.
Your conversion rate isn't a fixed number determined by your industry or your traffic quality. It's a direct reflection of the friction between your form and your calendar. The data from over a million form submissions makes this clear: 62% is the median, 78% is the top 10%, and the difference is operational, not aspirational. If you're sitting at 35-40% and treating that as normal, you're benchmarking against a process that the best teams have already replaced. Pick your highest-performing vertical, build a dedicated page with specific social proof, eliminate every manual step between form fill and booked meeting, and measure the difference over 30 days. The pipeline is already there. You just need to stop losing it in the handoff.
Let RevenueHero help your team turn high-intent users into booked meeting without slowing down your funnel.