
The Inbound Conversion Benchmark
Qualified-to-booked conversion benchmarks for B2B SaaS, based on 1M+ inbound form fills of RevenueHero customers.
Where Top Performers Stand
The top 10% of RevenueHero customers book nearly 8 out of 10 qualified leads into meetings. The median across all customers is 62%. The best performers hit 88%. These aren't cherry-picked case studies or theoretical benchmarks. This is aggregate data from B2B SaaS companies, weighted by volume, across a full calendar year.
The top 10% aren't just slightly better. They're booking nearly 8 out of 10 qualified leads. The best performer books 88%. The patterns that explain this gap are what this section is about.

Form Length Is a Red Herring
The "fewer fields = higher conversion" rule is so widely repeated that most teams treat it as gospel. The logic seems sound: every additional field is friction, and friction kills conversion. Cut the fields, boost the numbers.
But among top performers, this rule breaks down. We found companies converting at 77%+ with just 2 form fields. We also found companies converting at 76%+ with 13 fields. The link between field count and conversion is weaker than conventional wisdom suggests.
What does predict success? Purpose. Every field on a high-converting form does one of two things: it helps route the lead to the right rep, or it helps that rep personalize the demo. Fields that do neither are the ones that kill conversion, regardless of total count.

Your Button Copy Matters More Than You Think
CTA language seems like a minor optimization. A/B test fodder. Something the marketing intern can handle. But the data tells a different story. Among top-performing demo pages, "Book a Demo" and "Schedule a Demo" outperform "Request a Demo" and "Submit" by a significant margin.
The difference is psychological. "Request" implies uncertainty. You're asking for something; they'll decide whether to grant it. Maybe you'll hear back. Maybe not. The relationship is already unequal before the visitor even clicks.
"Book" and "Schedule" imply certainty. You're claiming a time slot. The meeting will happen. The decision is made. That subtle shift in language creates a subtle shift in commitment. The visitor mentally crosses the threshold from "considering" to "doing" while they're still on your page.

Top Performers Are More Selective
When we first looked at disqualification rates, we expected a clear pattern: either top performers DQ more (strict qualification protects rep time) or they DQ less (upstream filtering means only good leads arrive). We didn't expect what we found.
Among top performers, the top quartile actually disqualifies twice as many leads as the bottom quartile: 37.7% vs 18.7%. The companies with the highest conversion rates are the pickiest about who gets through.
The pattern makes sense once you think about it. Companies that are selective about who gets through to sales end up with higher-quality conversations. Reps aren't wasting time on poor fits. The leads who do make it through are more likely to show up, more likely to be engaged, more likely to convert.
Disqualification Rate by Performance
Top performers DQ 2x more leads
6+ Enrichment Providers in Real Time
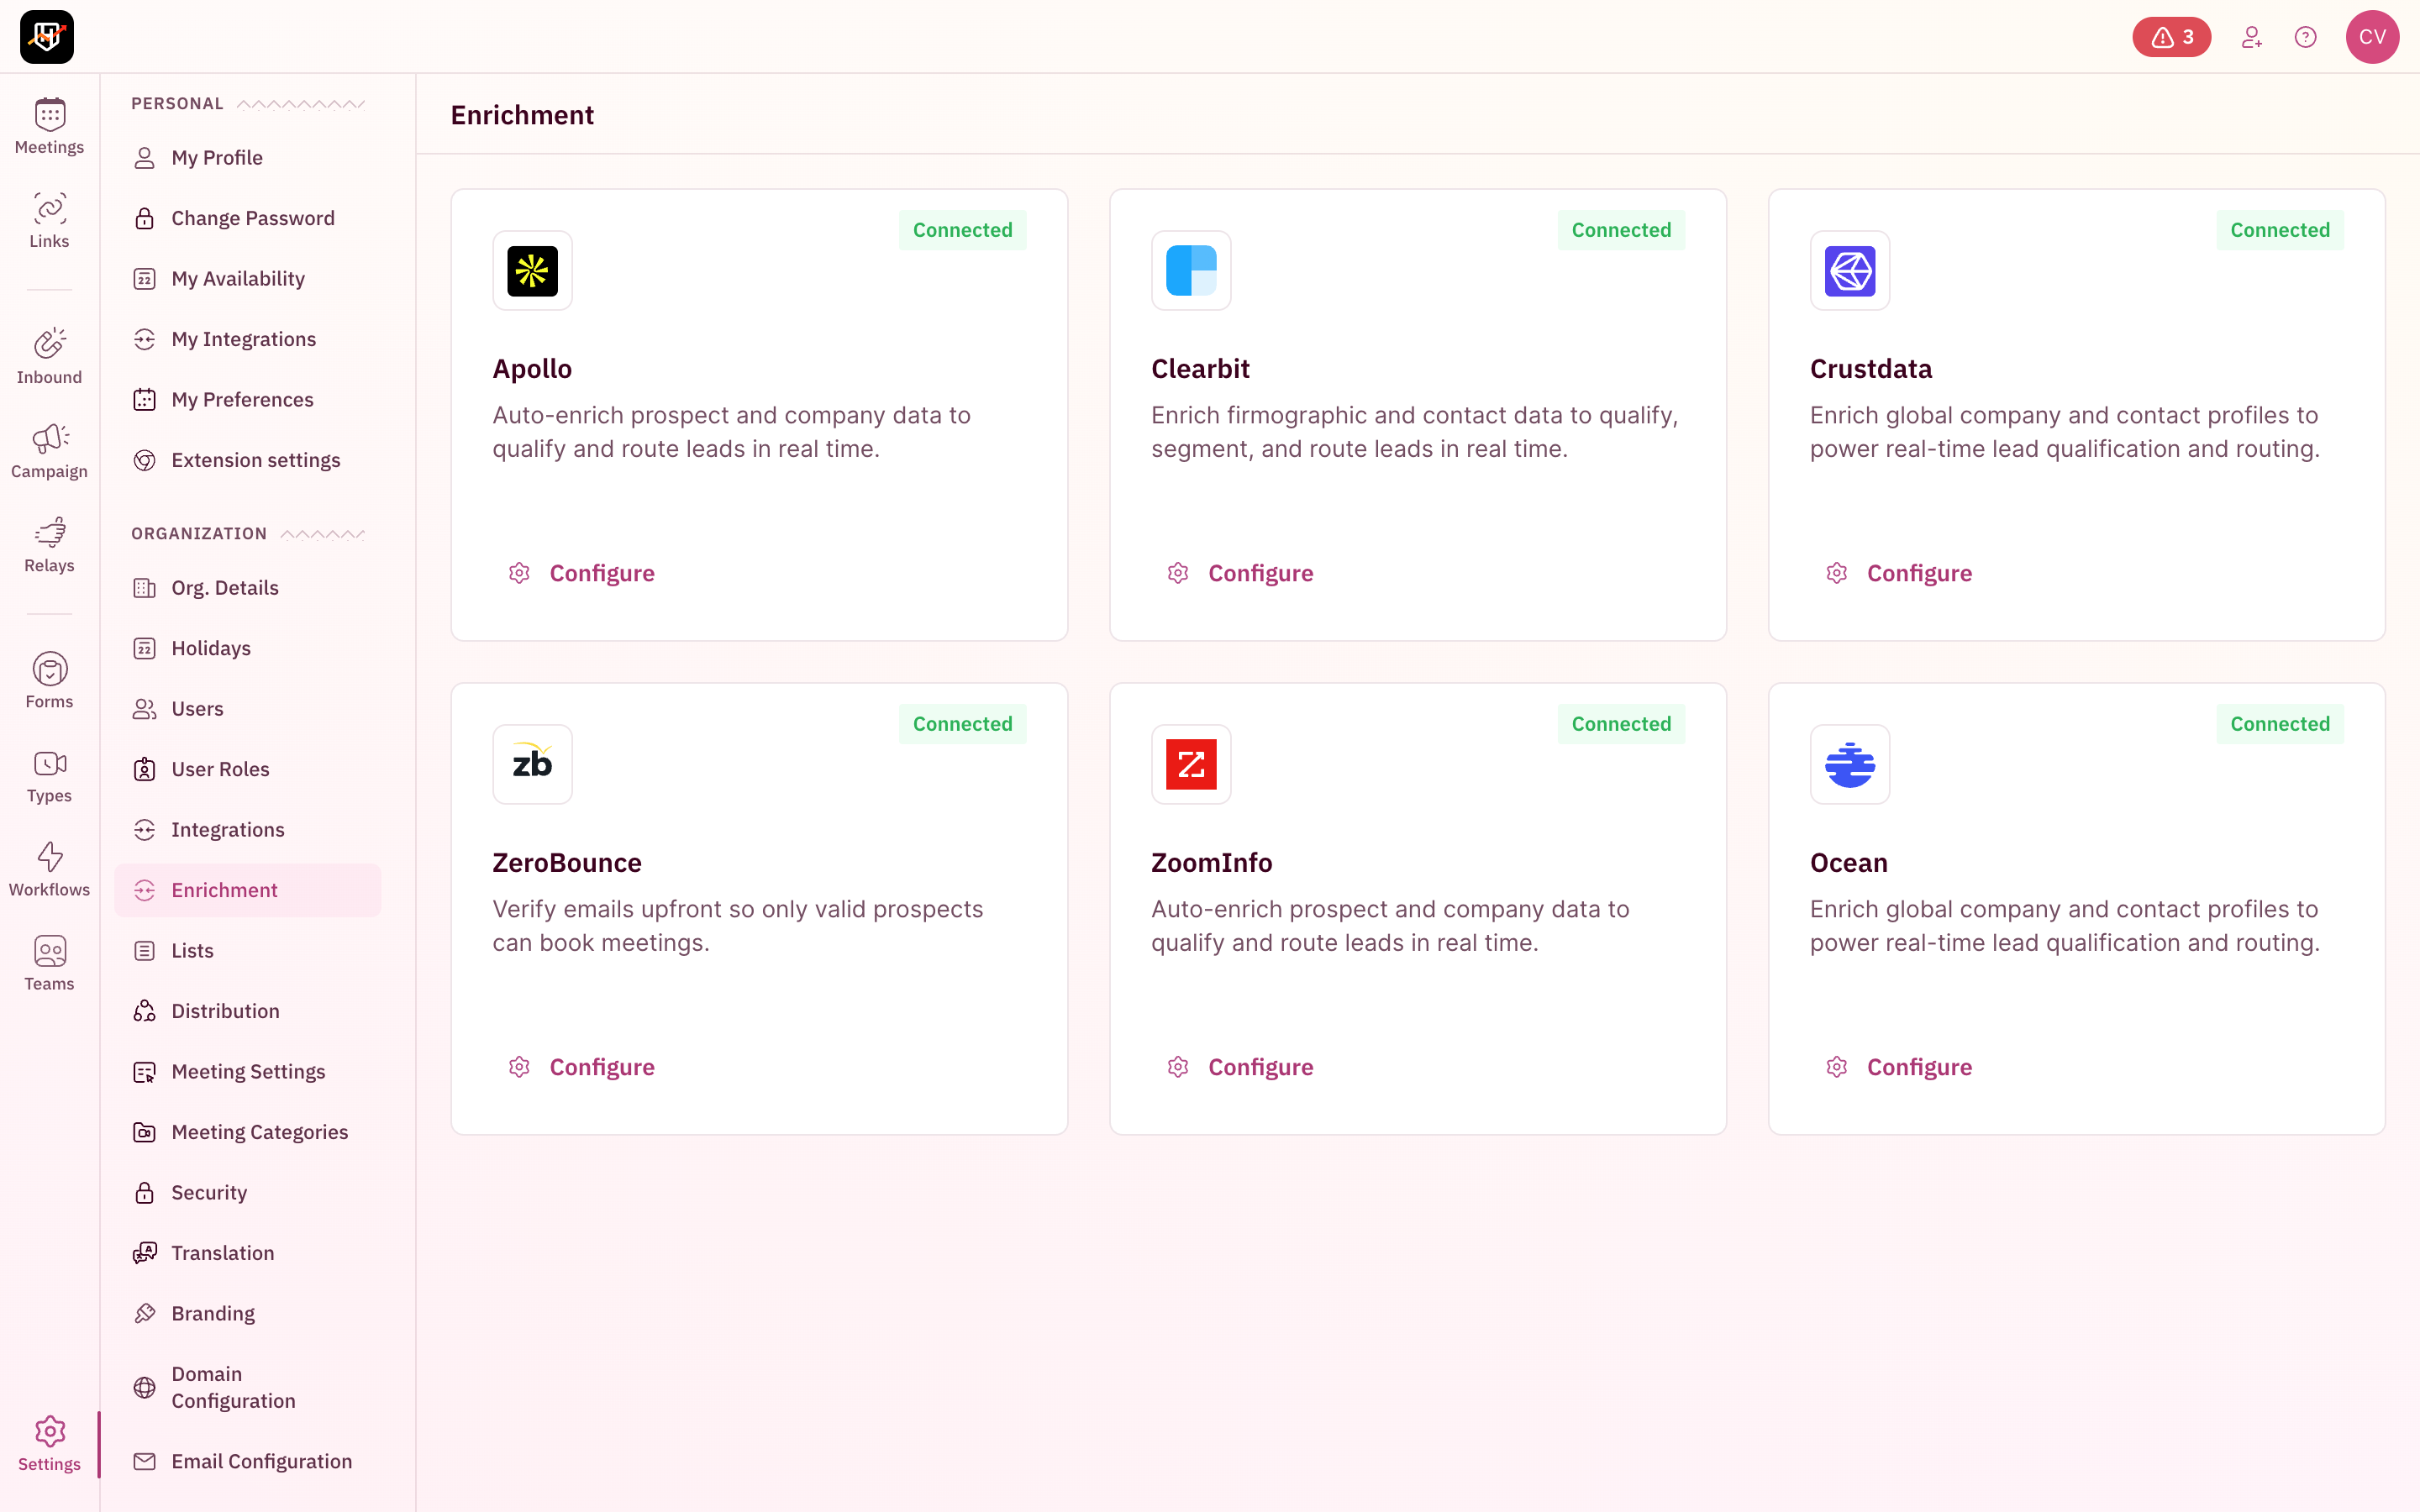
Companies converting at 78%+ run real-time enrichment on every form submission before showing the scheduler.
DQ Rules Top Performers Use
Auto-DQ invalid, spam, disposable emails before showing scheduler.
Used across all tiersBlock Gmail/Yahoo/Hotmail so only business emails see scheduler.
Top 25% performersDQ based on employee count using enrichment data.
Top 25% performersShow scheduler only in territories you serve.
Top 10% performersSpecific Proof Beats Generic Claims
76% of top-performing demo pages display customer logos. 57% include testimonials. 36% show G2 or Capterra badges. These numbers aren't surprising. Social proof is table stakes in B2B. Everyone knows they need it.
What separates good from great is specificity. "Trusted by 1,000+ companies" is vague enough to be meaningless. Every SaaS company claims some version of it. "Trusted by 2,500+ coffee shops and QSRs" is specific enough to be credible. The precision implies honesty. If you're willing to be that specific, you're probably not making it up.
If you're going to invest in social proof, and you should, invest in getting specific numbers from your best customers. Call them this week. Ask for one sentence with a metric. One testimonial with a number is worth ten without.

Enterprise Converts Higher, But DQs Way More
Enterprise companies lead with a 70.1% median meeting rate, nearly 9 points higher than Mid-Market (61.2%) and 7 points above SMB (63.2%). But they also disqualify far more aggressively: 71.2% of leads never make it through.
Compare that to SMB at 21.8% DQ and Mid-Market at 28.1%. Enterprise funnels are selective by design. Whether that's the right tradeoff depends on your sales motion and rep capacity.

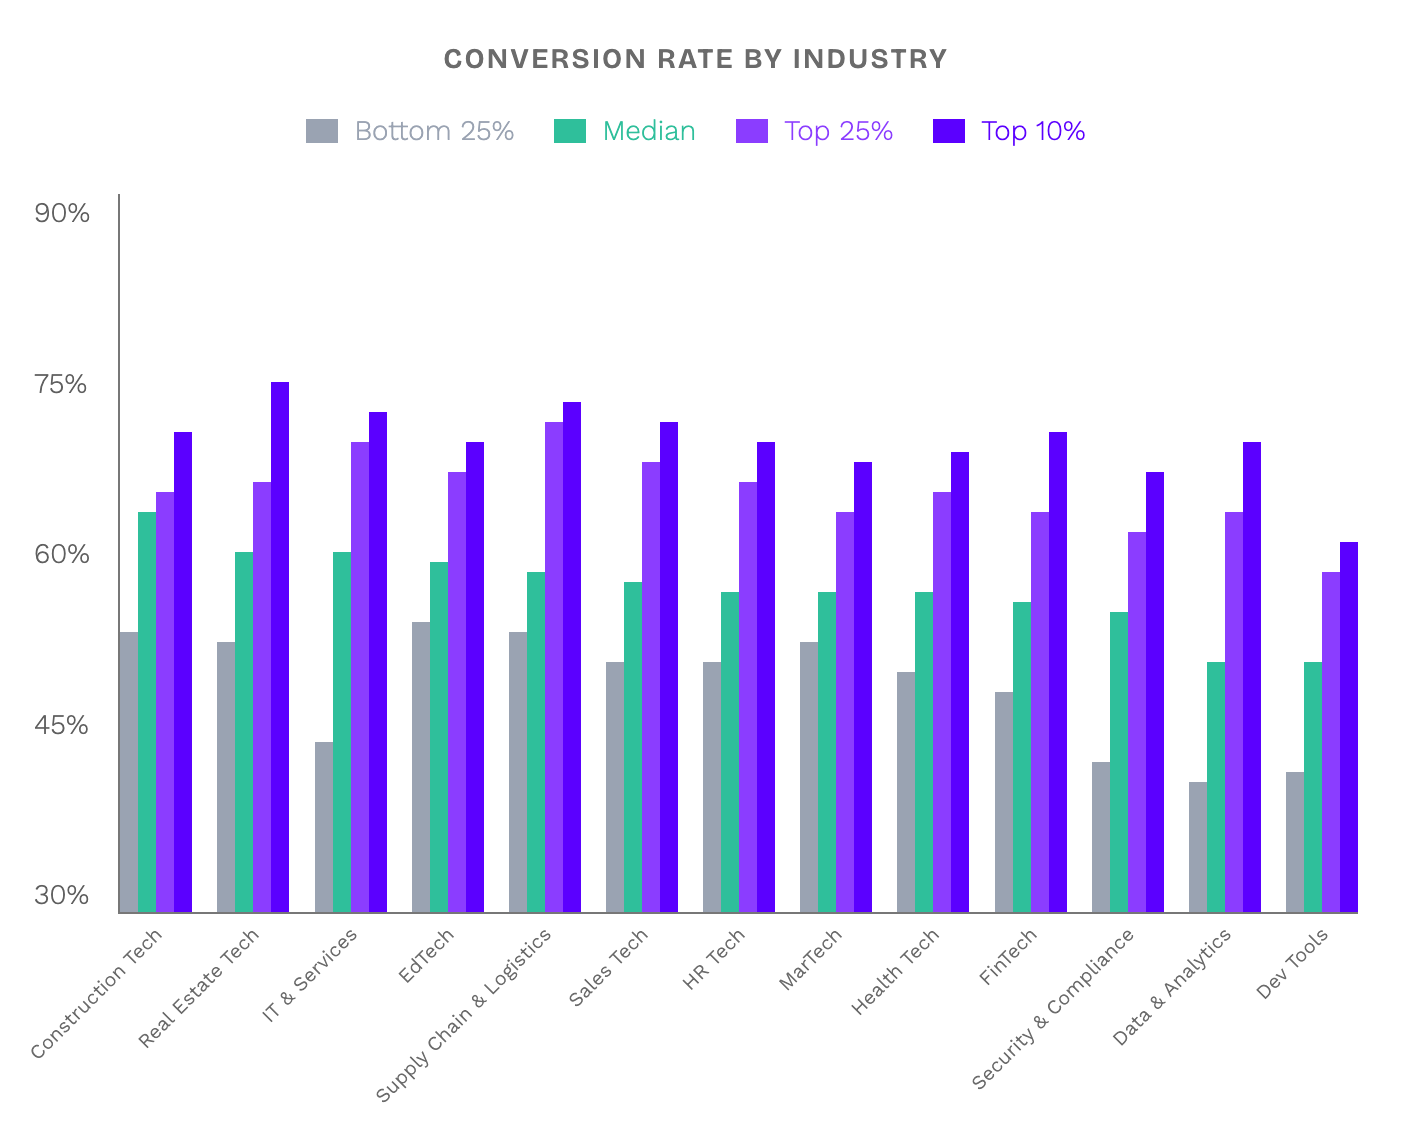
Vertical Software Wins
If there's one pattern that stands out across the entire dataset, it's this: vertical SaaS outperforms horizontal SaaS. Construction Tech leads at 69.1%. Ecommerce at 68.8%. Travel Tech at 68.3%. Compare that to horizontal Sales Tech at 62.8%. The gap is consistent and significant.
The advantage comes from clarity. When you sell to contractors, "are you a contractor?" is an easy qualification question. When you sell to "any company that does marketing," qualification gets fuzzy. Visitors aren't sure if they're the right fit. Reps aren't sure how to personalize the demo. Everything downstream gets harder.
If you're a horizontal product, consider vertical positioning on your landing pages. A "Marketing software for e-commerce" page will convert better than a generic "Marketing software" page, even if the product is identical. The specificity signals fit, which builds confidence, which drives conversion.
The Series A/B Valley
One of the more surprising patterns in the data: both early-stage and late-stage companies outperform the middle. Unfunded and seed-stage companies convert at 63.6%. Series D and PE-backed companies convert at 66.8%. Series A? 53.6%. Series B? 55.3%.
Early-stage companies have an advantage: founder-led sales, high-touch engagement, and the ability to treat every single lead as precious. Late-stage companies have different advantages: mature RevOps, optimized processes, and the budget to invest in tooling and headcount.
The middle is where things get messy. You're scaling fast. You're hiring SDRs who don't know the product as well as the founders did. You're under pressure to hit meeting targets, so you loosen qualification to pad the numbers. The companies that resist that instinct, that maintain qualification standards while investing in process, are the ones who emerge with strong funnels at scale.

August Is the Worst Month. January Is the Best.
Seasonality exists, but it's narrower than you'd think. Q2 leads at 61.0%. Q3 lags at 55.9%. The gap is about 5 points between the best and worst quarters.
The Q3 dip is driven almost entirely by August (53.4%) and September (53.7%). July actually performs well at 61.1%. If your late-summer numbers drop, the pattern is consistent with the broader market.
Q2 is the best time to push inbound campaigns. April, May, and June all exceed 60%. Plan your biggest launches accordingly.

Disqualification Rate by Performance
Top performers DQ 2x more leads
6+ Enrichment Providers in Real Time
Companies converting at 78%+ run real-time enrichment on every form submission before showing the scheduler.
DQ Rules Top Performers Use
Auto-DQ invalid, spam, disposable emails before showing scheduler.
Used across all tiersBlock Gmail/Yahoo/Hotmail so only business emails see scheduler.
Top 25% performersDQ based on employee count using enrichment data.
Top 25% performersShow scheduler only in territories you serve.
Top 10% performersExplore the Full Dataset
Sortable industry benchmarks and cross-tab breakdowns by company size and funding stage.
Company Size x Funding Stage
The same funding stage performs very differently at different company sizes.
What To Do About It
The patterns above aren't theoretical. They're drawn from companies actively booking 78%+ of their qualified inbounds. If you want to move in that direction, these are the highest-leverage changes based on what we observed. None of them require new tools or major investments. You can start today.
Among top performers, 29% use "Book a Demo," 21% use "Get a Demo," and 12% use "Schedule a Demo." Only 12% use "Request a Demo." The pattern is clear: commitment language outperforms permission language.
We saw top performers convert at 77% with 2 fields and at 76% with 13 fields. The number doesn't matter. What matters is whether each field does something useful.
76% of top-performing demo pages display customer logos. 57% include written testimonials. 36% show G2 or Capterra badges. But quantity isn't the point. The difference between high-performing pages and average ones is specificity.
Top performers disqualify twice as many leads as bottom performers (37.7% vs 18.7%). Being selective pays off. But the goal isn't to DQ more. The goal is to DQ intentionally.
Construction Tech converts at 69.1%. Ecommerce at 68.8%. Travel Tech at 68.3%. Generic Sales Tech at 62.8%. The pattern is consistent: vertical positioning wins.
How Top Performers Hit 78%+
Every company in this report uses RevenueHero to automate the moment after form submission. When a prospect requests a demo, they're qualified instantly based on form data and enrichment signals. The decision to book or disqualify happens in real-time.
The benchmarks in this report reflect what's possible when that handoff is automated. These companies treat inbound scheduling as their conversion event and not just the form fill. The old benchmark of 35% qualified-to-booked came from manual review queues and delayed follow-up. The companies in this dataset are proving that 60%, 70%, even 80%+ is achievable.
Leads are qualified instantly based on form data and enrichment signals. The decision to book or disqualify happens in real-time. Qualified prospects see the right rep's calendar immediately and book on the spot.
Qualified leads see a calendar immediately. They pick a time. The meeting is booked. No "someone will reach out" emails. No 3-day wait. The conversion happens while intent is highest.
Leads are routed to the right rep using form responses, enrichment data, and CRM ownership. No manual assignment. No delays. The rep who shows up to the meeting is the rep who should own the deal.
CRM records are created or updated automatically. Calendar invites go out. Reminders are scheduled. The rep gets context before the call. Nothing falls through the cracks.
We're short of CTA ideas.


