


Welcome to the twentieth edition of Breaking Inbound, your weekly deep-dive into inbound numbers and form-to-demo conversion rates across industries.
It’s 10 AM on a Monday morning. You’re looking at your pipeline report.
400 demo requests last week, 80 out of which turned into real conversations with your sales team. You sigh with relief, but your CEO shrugs; wondering what’s wrong with marketing.

A little Age of Empires humor for the ones who get it 😉
Actually, everything’s working well.
Especially if you’re in fintech, this is what good looks like. And let’s say your DQ rate is 65%.
Naturally, your VP of Sales asks: “Why are we throwing away two-thirds of our inbound?”
There are two ways to respond:
Way 1: Accept the premise, loosen the filters, and let in a few more geographies. And lo, demo request volume doubles by the next two weeks. But you’re in fintech. Half of the new “qualified” leads are from states where you’re not licensed to operate. A third don’t meet your employee criteria range, and your AEs burned 40 hours last month on demos that were people “just trying to understand how your solution works”.
Way 2: Defend your choice to avoid pipeline bloating and convert the next seven out of ten qualified handraisers into booked meetings.
Our fintech customers follow the second way, converting 70%+ while DQing between 50-90%.
We broke down their playbook in this edition. Read below ⬇️
Fintech DQs 70% of its pipeline (on purpose) ❌
Several fintech companies on our platform routinely disqualify 50 to 90% of their inbound demo requests on purpose.
These include students, businesses who don’t meet the company size criteria, individuals from unsupported geographies, and so on. Without aggressive enrichment-based qualification at the form level, your AEs’ calendars fill with meetings that never close.
Geography matters more than you think 📍
In financial services, a lead from the wrong state isn’t low quality. They’re legally unserviceable. A payments company licensed in 30 states in the US cannot serve leads from the other 20. A lending platform with regional compliance restrictions routes those leads straight to DQ. The companies with the highest DQ rates in fintech have the highest win rates on the meetings that they take.
The data backs this up 📊
One of our customers, an SMB Series A fintech company has maintained a DQ rate above 50% for 20 consecutive weeks. This week, they DQ’d 54% of their traffic, and converted the remaining qualified leads at 87.5%. Over these 20 weeks, they averaged a 63% DQ rate and an 85% meeting conversion rate ✨
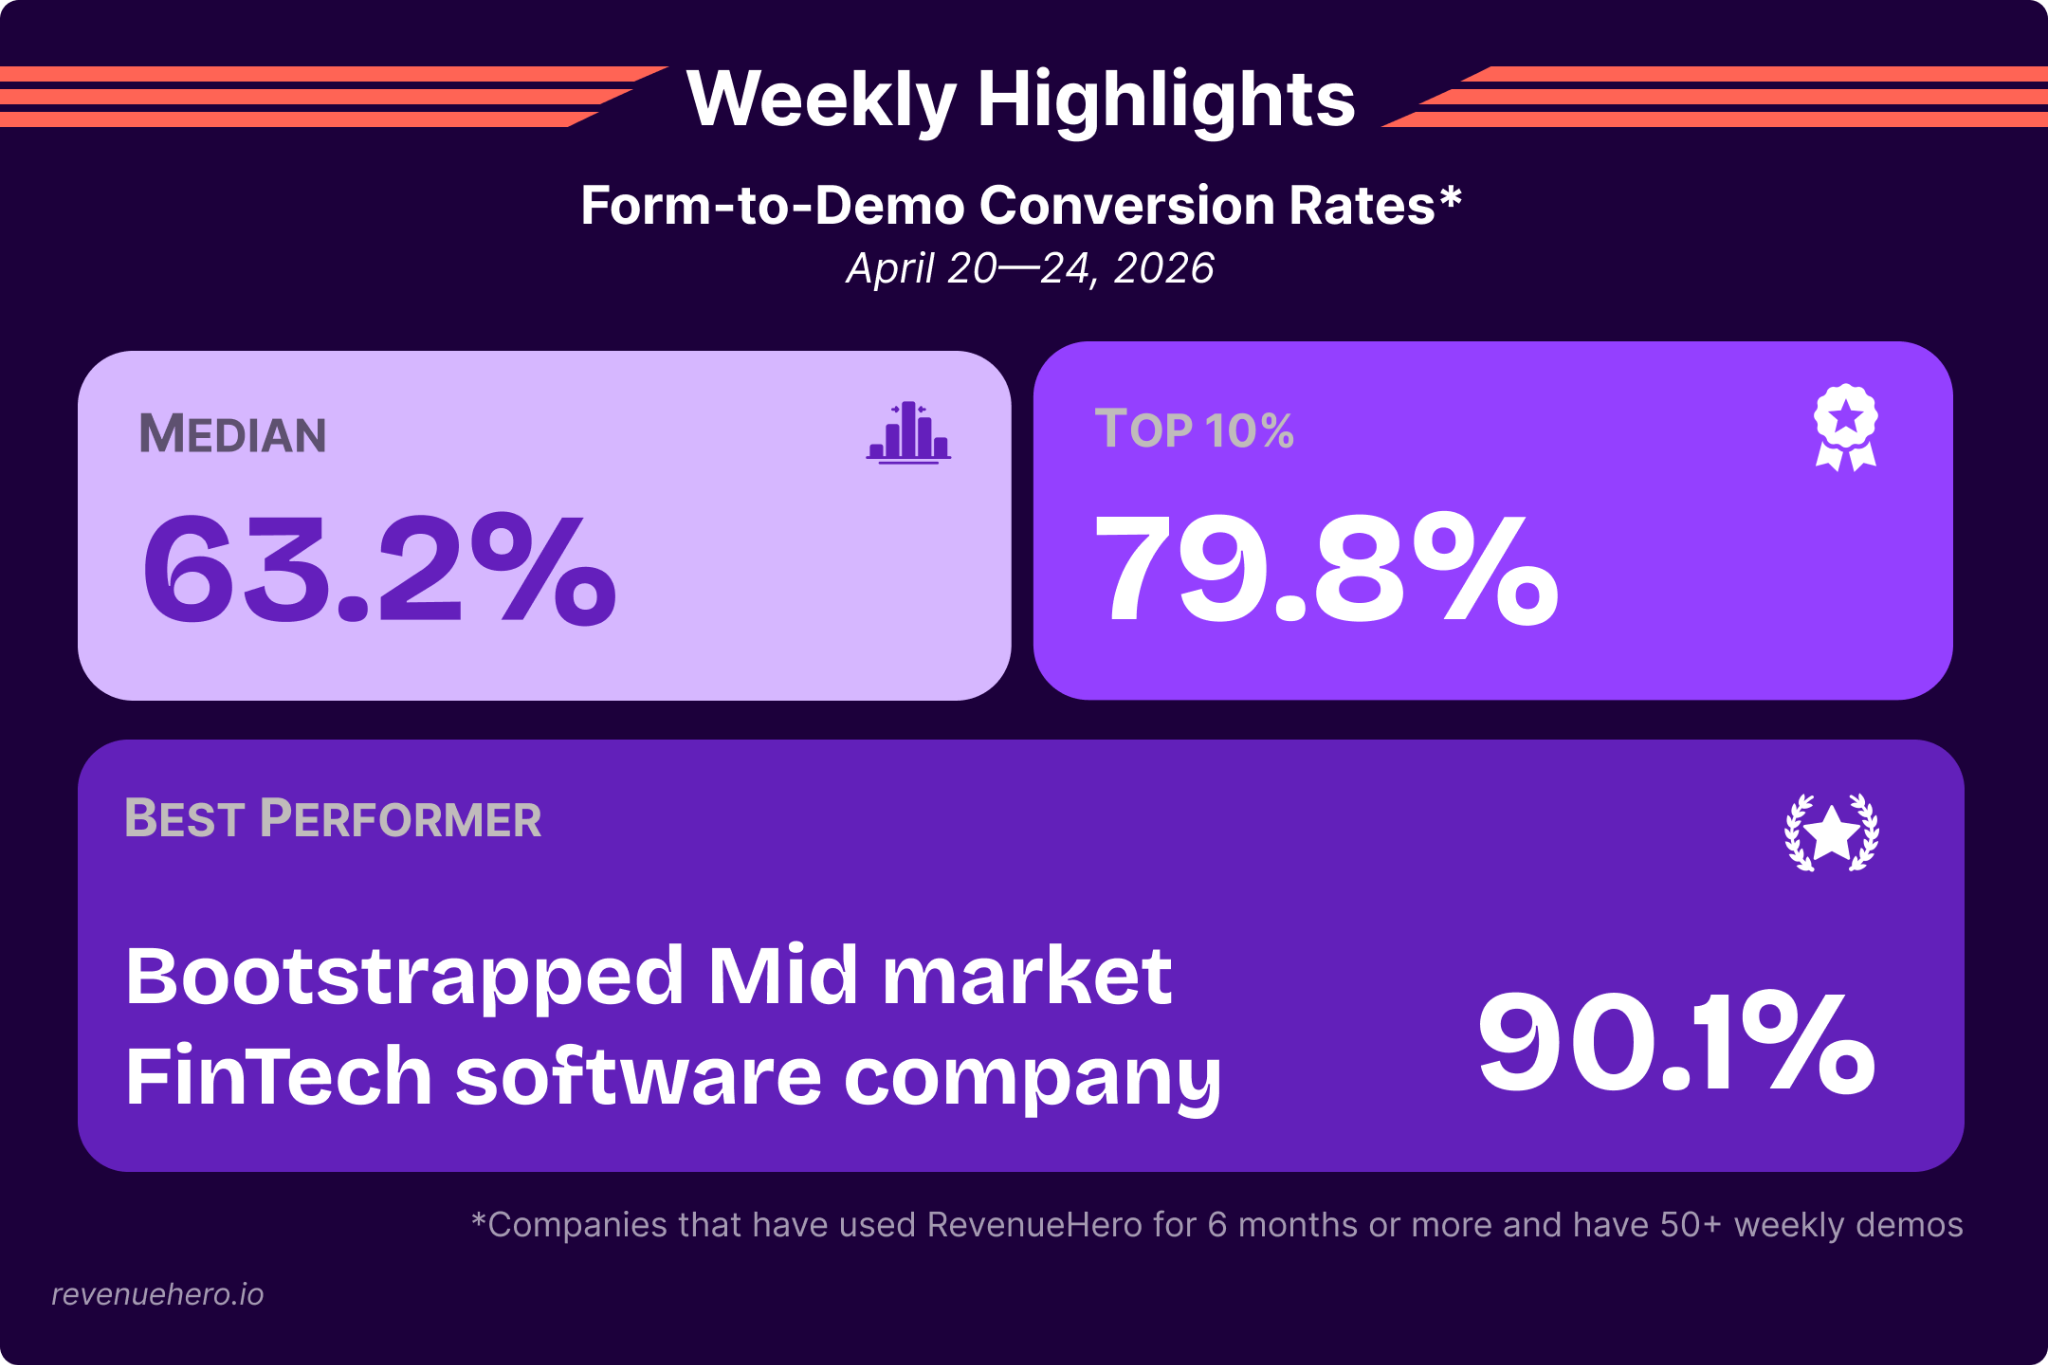
Last week’s best performer was also a fintech company (coincidence? 🤯): a bootstrapped mid-market company that DQ'd 39% of its demo requests and converted 90.1% of the qualified leads into meetings, the highest form-to-demo conversion rate across all eligible companies* this week.
*Eligible companies: Those who have used RevenueHero for 6 months or more, and receive 50 or more weekly demo requests
Our fintech customers who had a DQ rate of above 30% averaged a 75.5% meeting conversion rate, while those who DQ’d below 30% averaged 67.8%: a 7.7% gap. Higher selectivity leads to higher conversion. Every time.
How the best teams are implementing this right now
One of our customers configured employee-count thresholds directly in their RevenueHero form, so that any lead from an organization that doesn’t match their criteria gets disqualified before a rep sees it.
Another integrated enrichment into their qualification flow, feeding company size, industry, and geography data into routing rules in real time. The enrichment happens at form submission, and by the time the booking widget loads, the unqualified leads vanish.
Both approaches accomplish the same thing: filtering happens at the form, and the AE never sees the meeting that shouldn’t have been booked.
If your fintech demo form asks for name, email, and company, you're probably letting too many leads through. The teams converting 80%+ are qualifying on employee count, revenue range, geography, and use case before the scheduler loads.
Fintech company or not, you gotta ask: is your DQ rate too low?
Last week, companies who DQ’d 50–70% of their inbounds averaged a 71.7% meeting conversion rate. Those in the 0–10% DQ rate average 57.5%.
And if you’re looking to bridge that 14% gap with enrichment-based qualification and smart routing, try RevenueHero now.
Onto the regular weekly numbers now ⬇️
Weekly Highlights ✨
The best performer last week was a bootstrapped mid-market fintech software company (Coincidence? 🤯). Here’s what we learnt from their demo page:
- The homepage leads with "Get started for free" as the primary CTA, repeated across the hero and body sections.
- Homepage also has a “1,000+ businesses trust” claim, along with twelve customer logos
- Their pricing page offers a “Book a Demo” CTA, which lands at their demo page
- Their demo form has 8 fields in a 2-step flow: they capture the demographic information in the first section and use qualifiers in the second one
- Their qualifiers include enquiries on company size, current tech stack, and tech budget
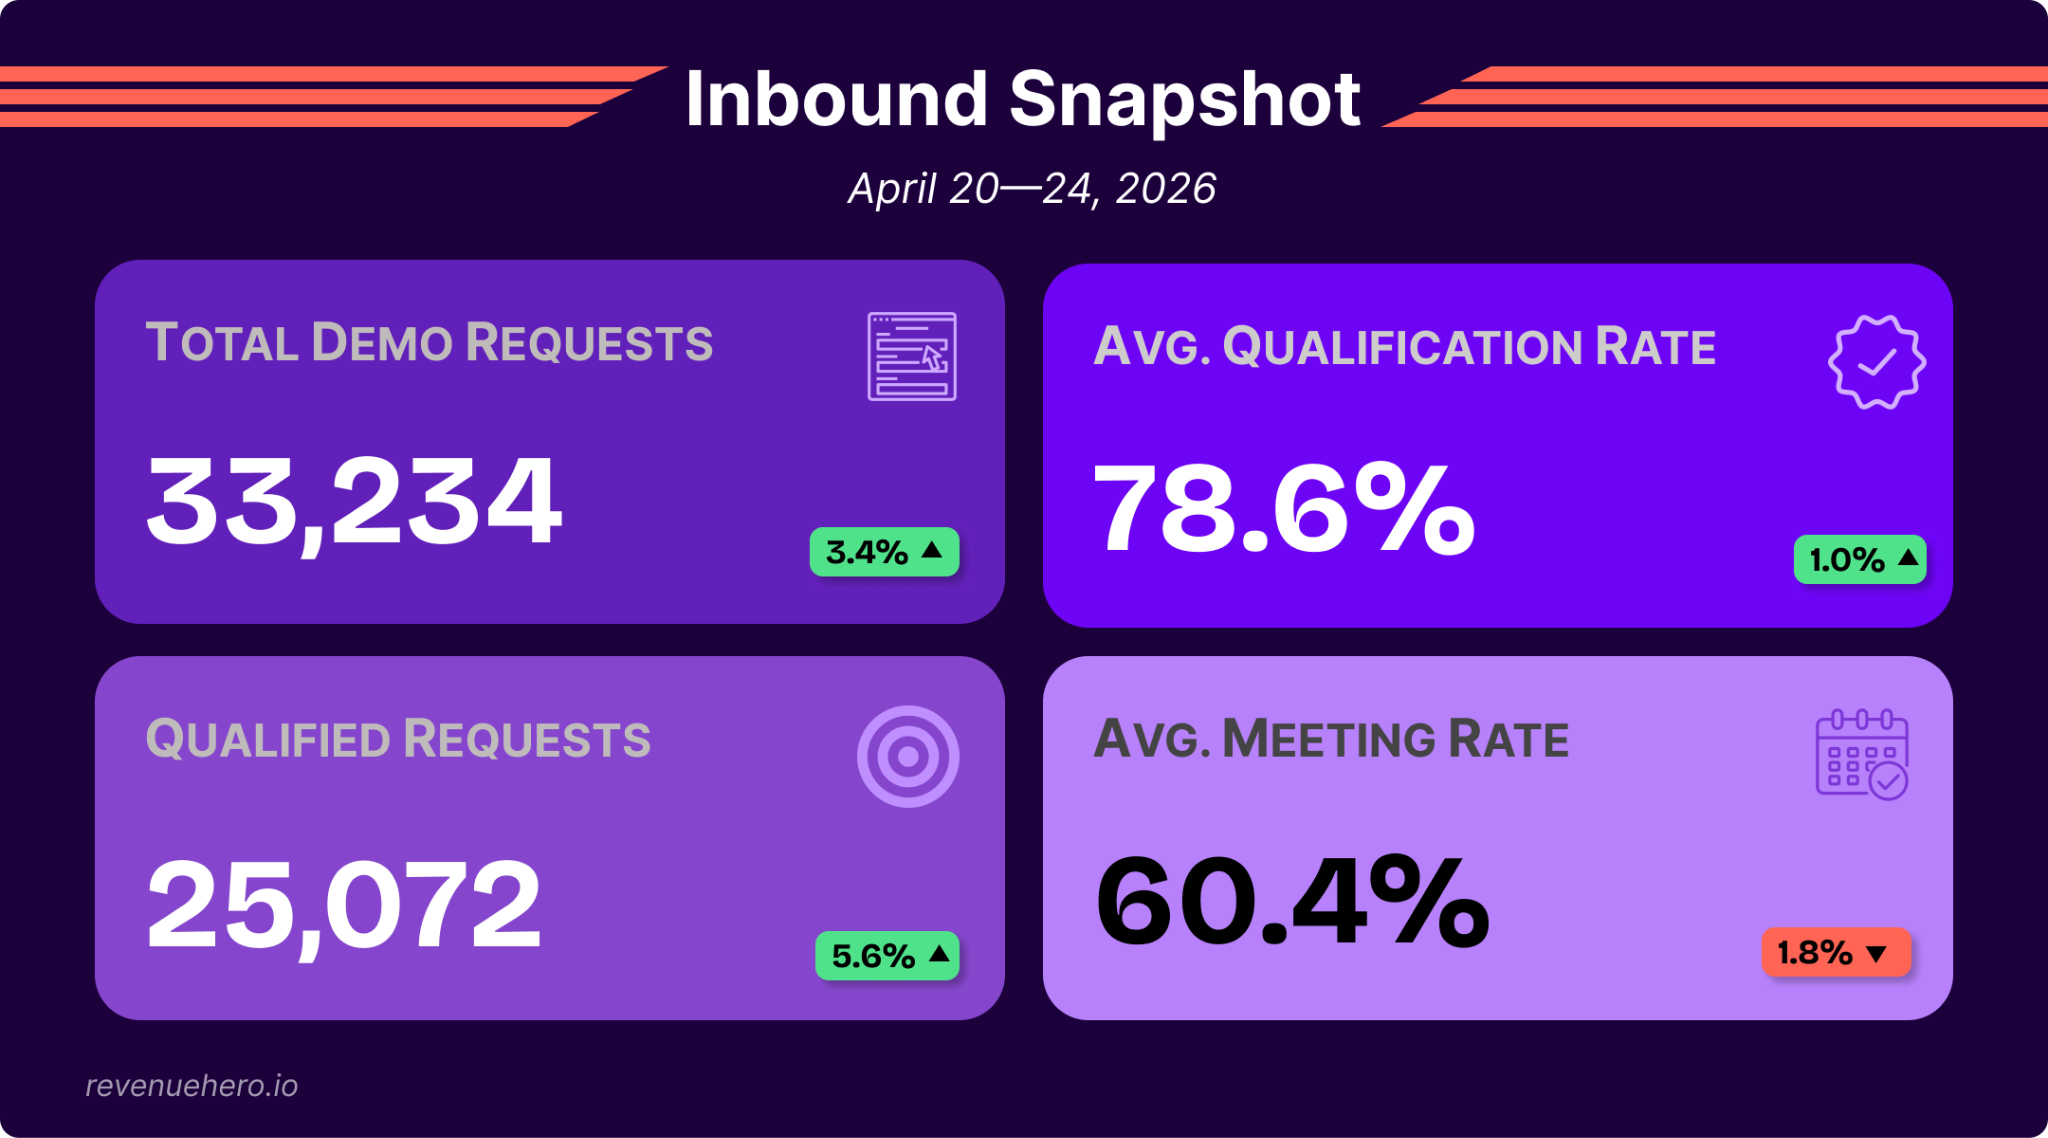
Inbound Snapshot
The funnel widened again this week, marking three consecutive weeks of volume growth. Demo requests rose 3.4% to 33,234, and qualified requests jumped 5.6% to 25,072. Qualification rates saw a 1% uptick last week. However, form-to-demo conversion rates slipped 1.8% to 60.4%.
While more qualified leads showed up, fewer booked meetings. The volume-to-conversion gap saw a slight widening last week.
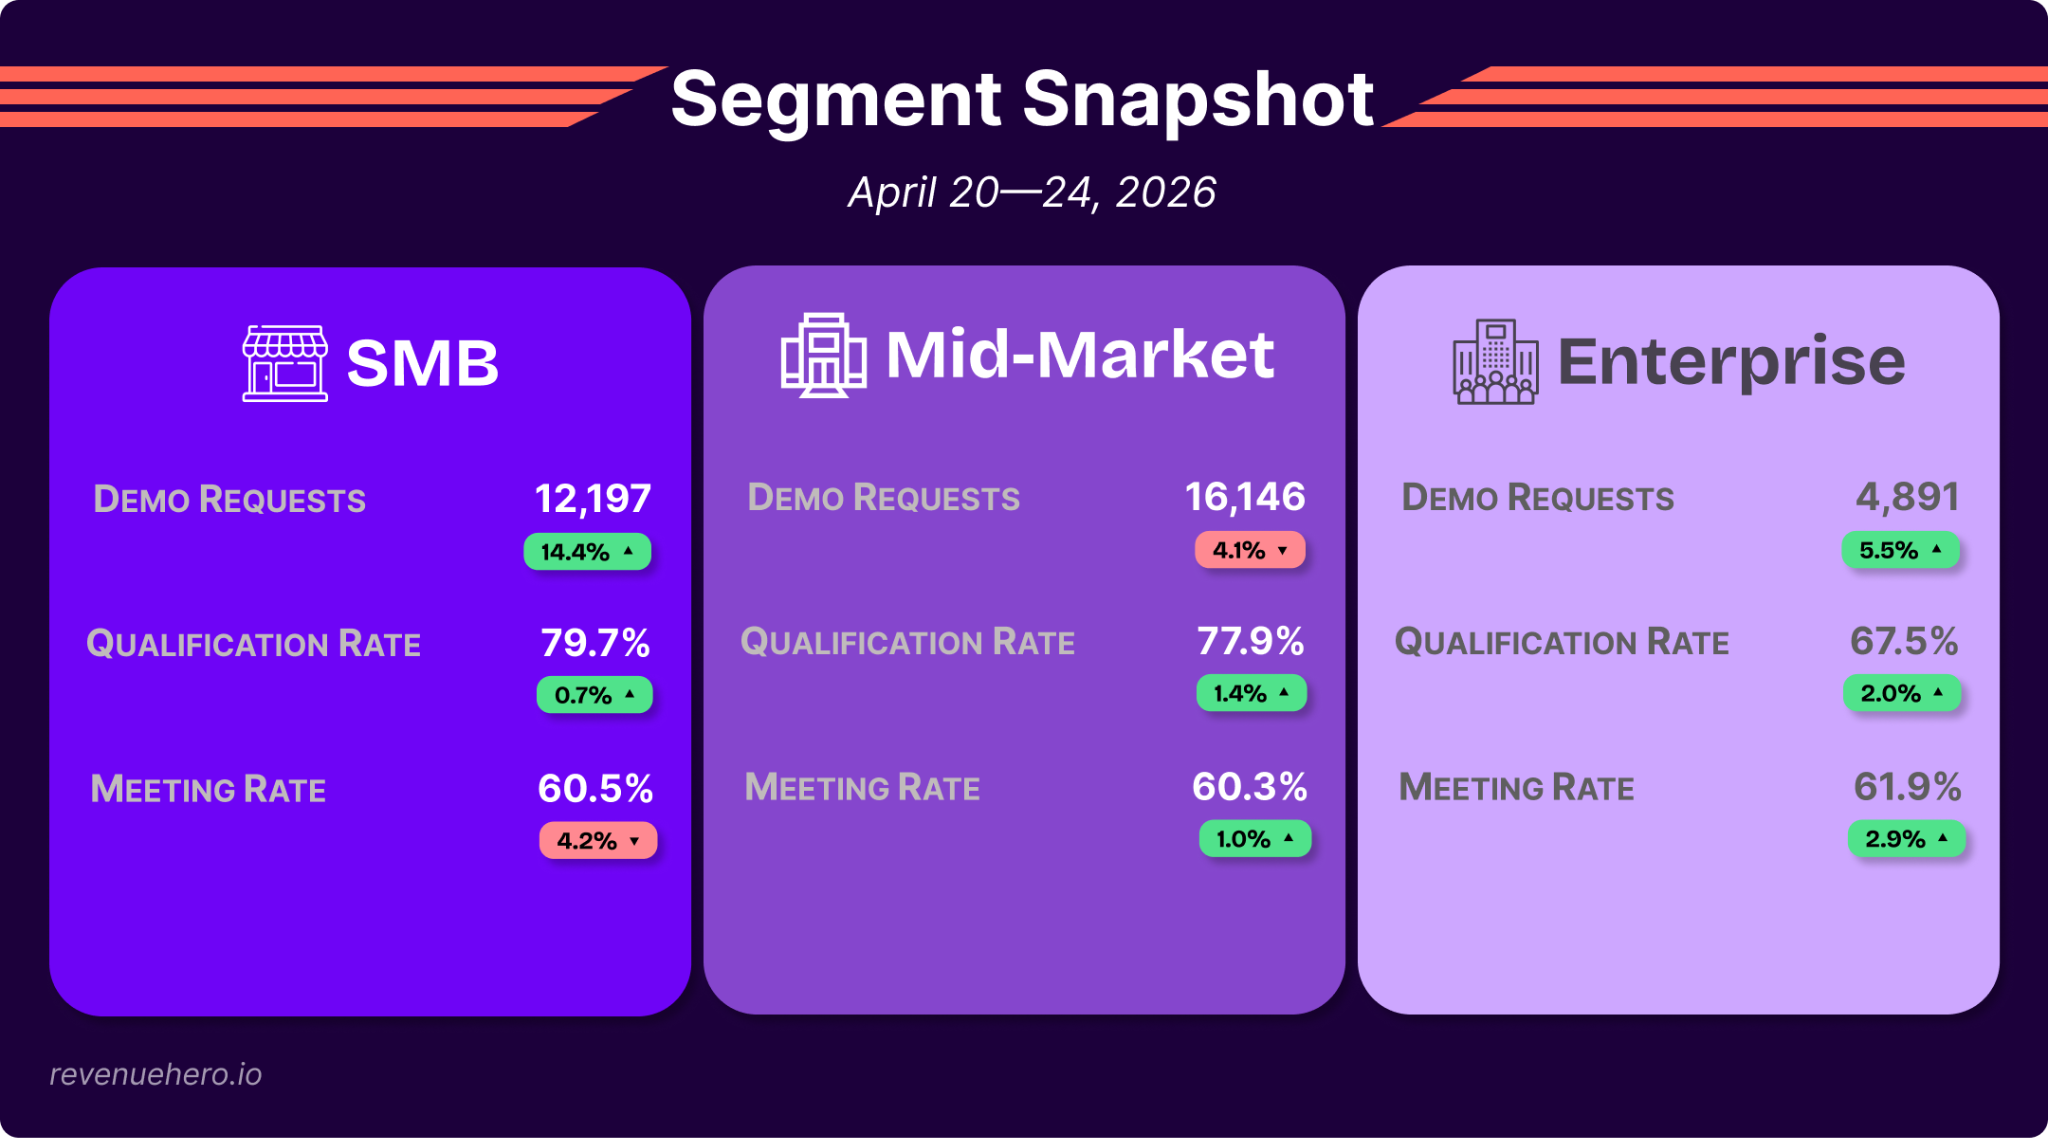
Segment Snapshot
SMB deluged with demo requests this week, with a 14.4% surge. While qualification rates held steady at 79.7%, form-to-demo conversion rates dipped 4.1%, giving back the previous week’s 3.8% gain. If you’re in SMB and seeing more traffic without them translating into meetings, your demo form is letting leads through that your reps can’t convert. Check whether your page qualifies on company size or use case before showing the calendar.
Mid-market cut back on volume, but held conversion steady. Demo requests dipped 4.1%, while qualification rate ticked up 1.4% and meeting conversion rates remained steady at 60.3%. This is a stabilization week for mid-market after three weeks of whiplash.
Enterprise had a comeback story last week: demo requests jumped 5.5%, qualification rates improved by 2%, and form-to-demo conversion rates saw a 2.9% uptick compared to the previous week. Enterprise outbeat the other two for the first time in three weeks.
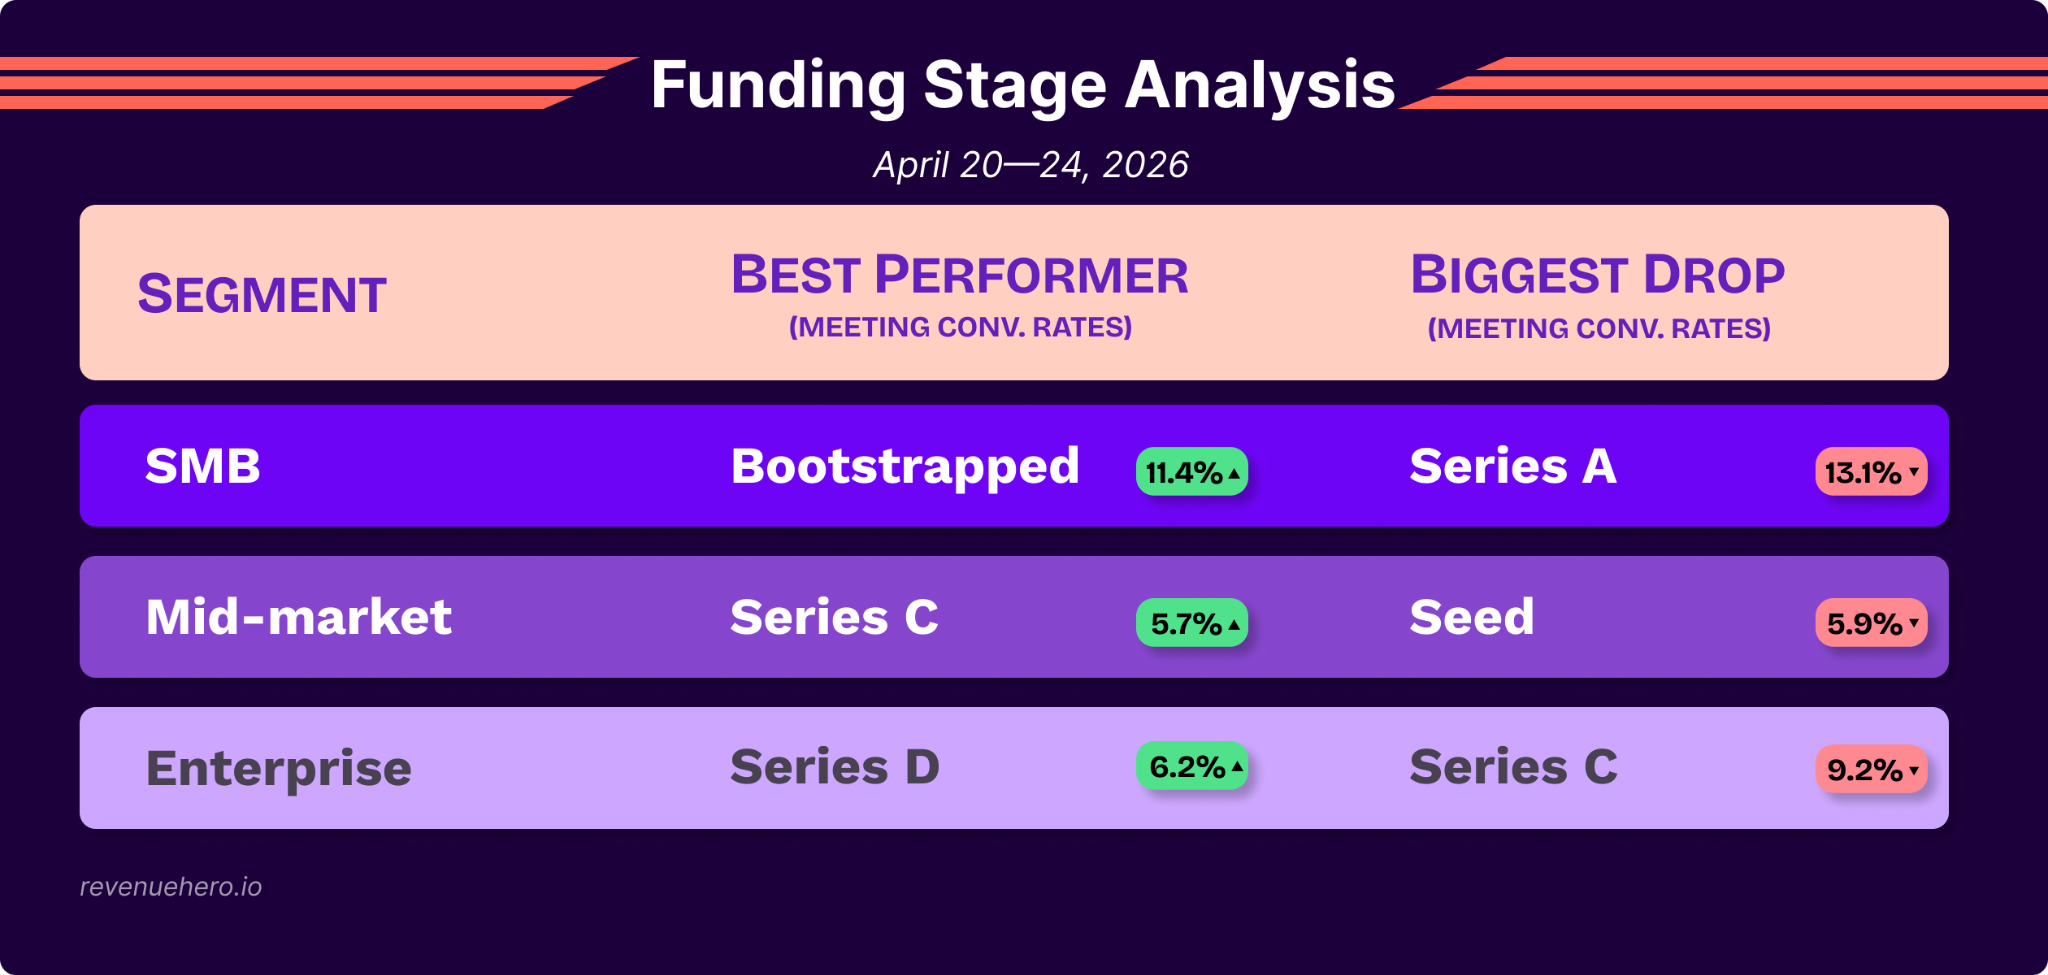
Funding Stage Analysis
SMB bootstrapped kept the momentum strong, soaring 11.4% to earn the largest gain in the entire table. SMB Series C jumped 7.5% to 81%, holding its position as the highest-converting SMB cohort, while mid-market Series C saw a 5.7% surge in form-to-demo conversion rates. Enterprise Series D continued its gains as well, climbing 6.2% last week.
On the other end, SMB Series A plummeted 13.1% to 55%, the steepest decline across segments and funding stages. Mid-market seed companies saw a 5.9% drop, while meeting conversion rates plunged by 9.2% for enterprise Series C companies.
If you’re in the SMB Series A cohort watching conversion fall below 55%, audit your demo page today. Our analysis of the 50 top-performing demo pages shares a template for you to get started with.
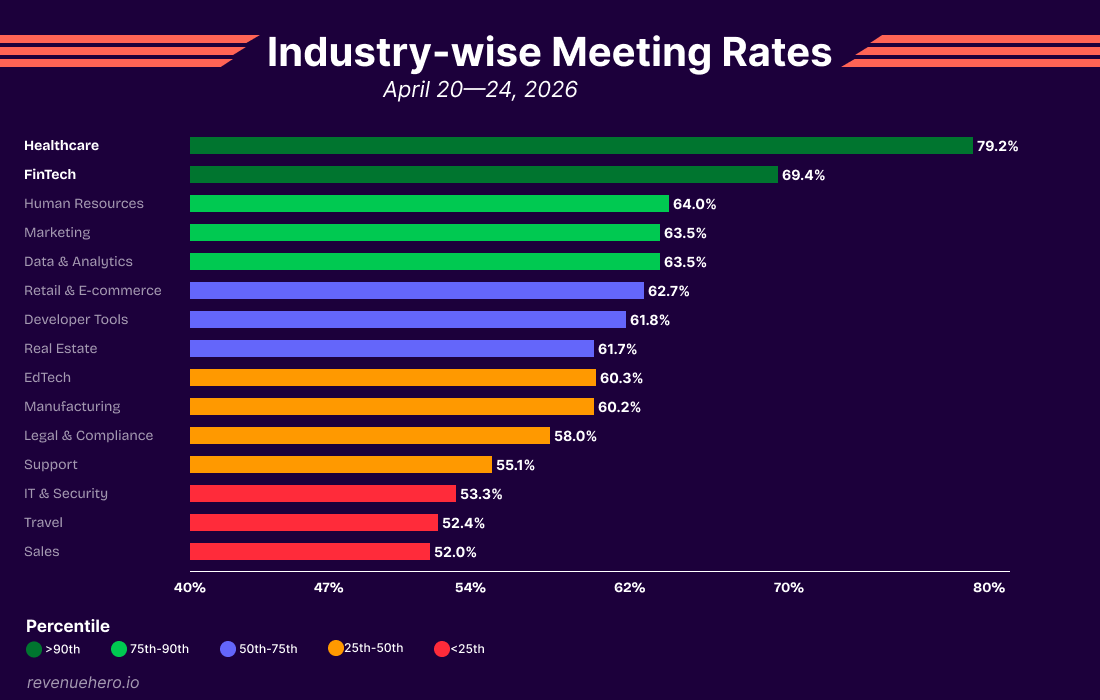
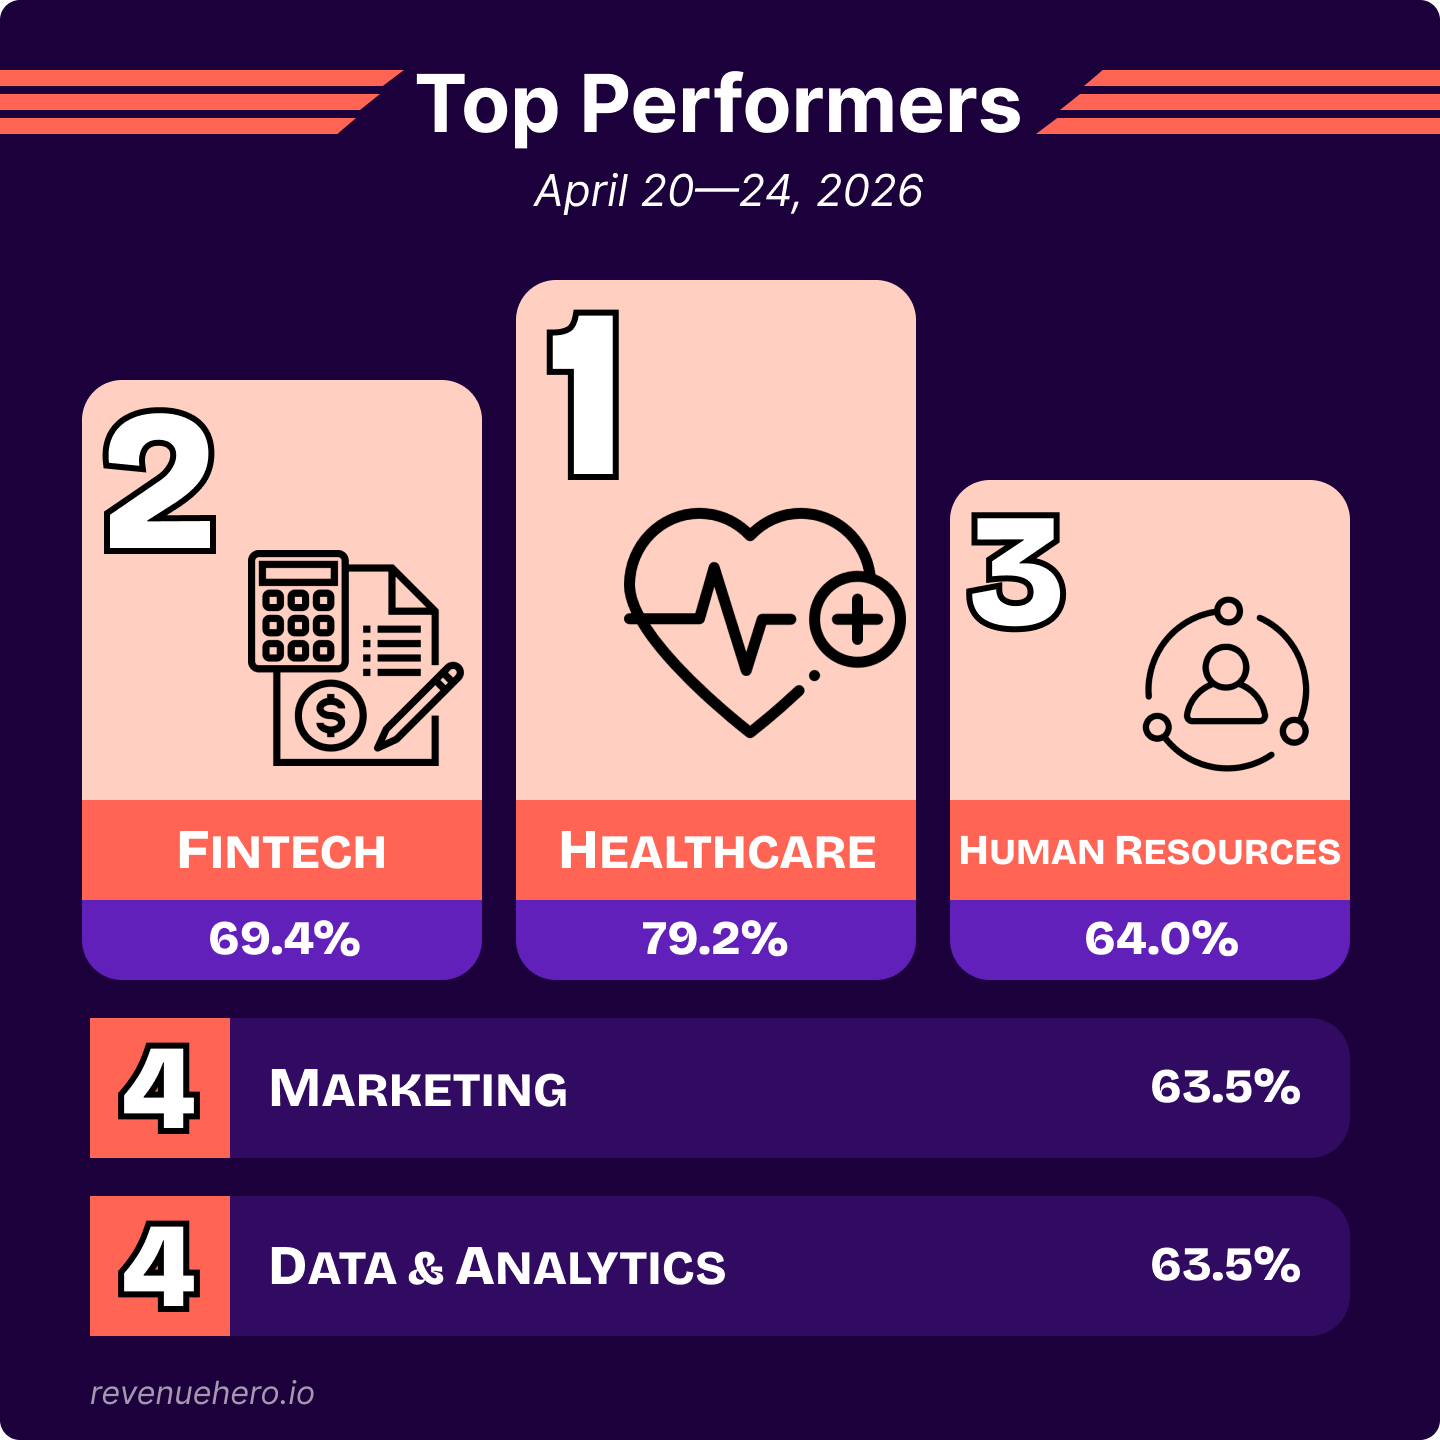
Industry-wise Meeting Rates
Healthcare jumped 7.8% to 79.2%, the industry’s all-time high. It has now held the crown for eight out of 20 weeks! 💫
FinTech ticked up 1% to 69.4%, staying in the top three for the second consecutive week and improving week-on-week in Q2. But the highlight of the week was developer tools, soaring 10.3% to hit a 61.8% form-to-demo conversion rate last week, jumping seven places in the table.
Real estate plummeted big time: tumbling down to 61.7% after a 17.7% dip. Travel plunged 12.1% dropping to below 25th percentile, while Sales hit its lowest reading in six weeks after taking a 4.6% hit.
All industries converted 50%+ of their qualified inbounds into booked meetings, with 47% of industries witnessing steady or better form-to-demo conversion rates.
The Leaderboard
Healthcare grabbed the crown for the eighth time, splitting the gap between #1 and #2 by a whopping widened the gap between the #1 and #2 spots by 9.8%. Fintech came in second with 69.4%, while human resources took the third place with 64.0%, completing the podium.
Key Observations
- Volume grew for the third straight week: Demo requests rose 3.4% to 33,234 and qualified requests jumped 5.6% to 25,072. Form-to-demo conversion rates ticked down 1.8% to 60.4%, ending the two-week uptrend.
- SMB flooded in but didn't convert: Demo requests soared 14.4% to 12,197, but meeting conversion rates dipped 4.1% to 60.5%. SMB Series A plummeted 13.1% to 55.0%, dragging the segment down.
- Enterprise reversed last week's decline: Demo requests jumped 5.5% to 4,891 and form-to-demo conversion rates ticked up 2.9% to 61.9%, retaking the top segment spot for the first time in three weeks.
- Mid-Market held steady: Demo requests dipped 4.1% to 16,146, but qualification rate ticked up 1.4% to 77.9% and meeting conversion rates remained steady at 60.3%.
- Healthcare skyrocketed to its all-time high at 79.2% (+7.8%). Developer Tools soared +10.3% to 61.8%, recovering from last week's 51.5% and jumping seven spots in the industry rankings.
- Real estate plummeted -17.7% to 61.7%. Travel plummeted -12.1% to 52.4%, while sales dipped -4.6% to 52.0%, its lowest reading in six weeks.
- SMB Bootstrapped soared +11.4% to 69.7% and SMB Series C jumped +7.5% to 81.0%. A Bootstrapped Mid-Market FinTech company hit 90.1% meeting conversion rate on 116 demo requests, and the 90th percentile dropped to 79.8% compared to the previous week’s value of 82.7%.
We'll be back next week with a fresh batch ✨
Until then, keep those meetings flowing 📈


