


Welcome to the seventeenth edition of Breaking Inbound, your weekly deep-dive into inbound numbers and form-to-demo conversion rates across industries.
Q1 2026 is finally in the books.
And we’ve been cooking religiously.

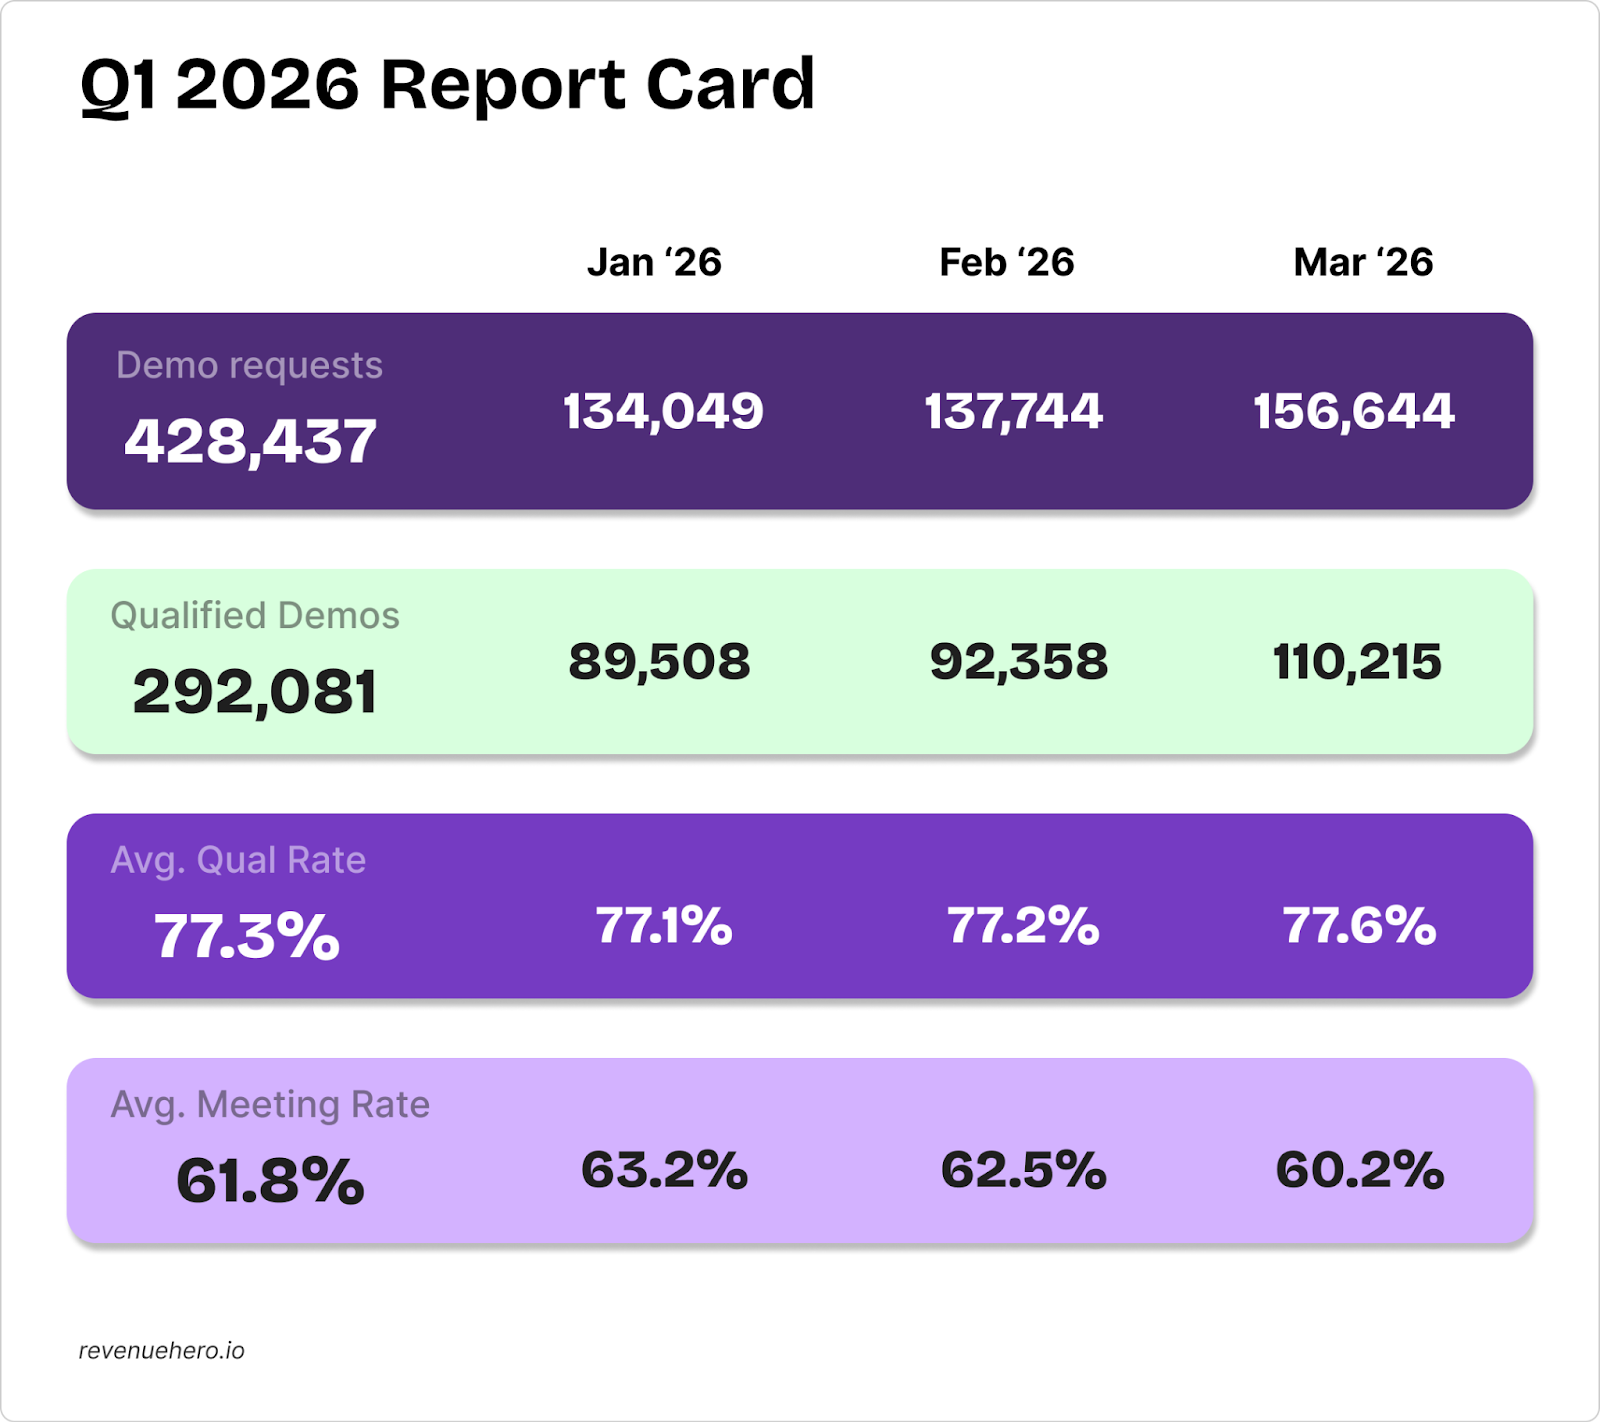
We’ve been consistently tracking inbound numbers and form-to-demo conversion rates for the last thirteen weeks. Our customers received 428,000+ demo requests, with an average qualification rate of 77.3%.
The full report card is below ⬇️
Q1 2026 Inbound Report Card: 13 weeks. 428,000+ form fills. One clear trend 🔥
2026 opened with a spectacular Q1 🔥
Across 13 weeks, RevenueHero’s customers generated over 428,000 demo requests. The average weekly qualification rates held at 77.3% across all 13 weeks, barely moving by more than a percentage point in either direction.
However, the average form-to-demo conversion rates hit the peak of 64.4% during Week 4, and saw a declining trend.
Here’s the full story ⬇️
The report card
🏥 Healthcare: The industry that owned Q1 2026
Healthcare held the #1 industry spot for 6 out of the 13 weeks recorded: more than any other industry. It opened Q1 2026 at 62.9% and closed at 73%, a 10.1% surge in form-to-demo conversion rates. The consistency was also striking: healthcare never once dropped below the 62% median benchmark.
P.S. We published the healthcare tech conversion playbook earlier, based on what our top healthcare tech customers did with their inbound process.
💸 FinTech: The rise, the fall, and the recovery
FinTech was the Q1 rollercoaster. It opened at 70.7% in Q1, climbed to a peak of 78.2% five weeks later, and then entered the longest declining streak: seven straight weeks. Form-to-demo conversion rates fell to 61% in the second last week of Q1 2026, but in the last week, it jumped 5.3% to 66.3%. Hope this momentum continues in Q2! 💪
📊 Data & Analytics: The industry that took the biggest hit
Data & analytics software started Q1 2026 at 69.9%, a top performer. Come the last week of Q1, it sat at 54.5%: witnessing a 15.4% decline across the quarter, the steepest of any industry. The collapse was the sharpest in the sixth week, where the category fell below 50%. There was a brief recovery two weeks later, but the slide resumed. No other industry lost more ground in Q1.
👑 The repeat champion 👑
One of our customers, a bootstrapped SMB sales software company, emerged as the best performer for 4 out of the 13 weeks tracked, including two weeks where they hit a perfect 100% form-to-demo conversion rate. No other company won more than once.
Here’s what we learnt from their demo page:
- They offer a free trial and use “Talk to an expert” as their CTA
- Their demo page shows 4 customer testimonials with specific product value & 10 customer logos
- Their demo form has 12 fields, with 5 fields that help them in lead qualification
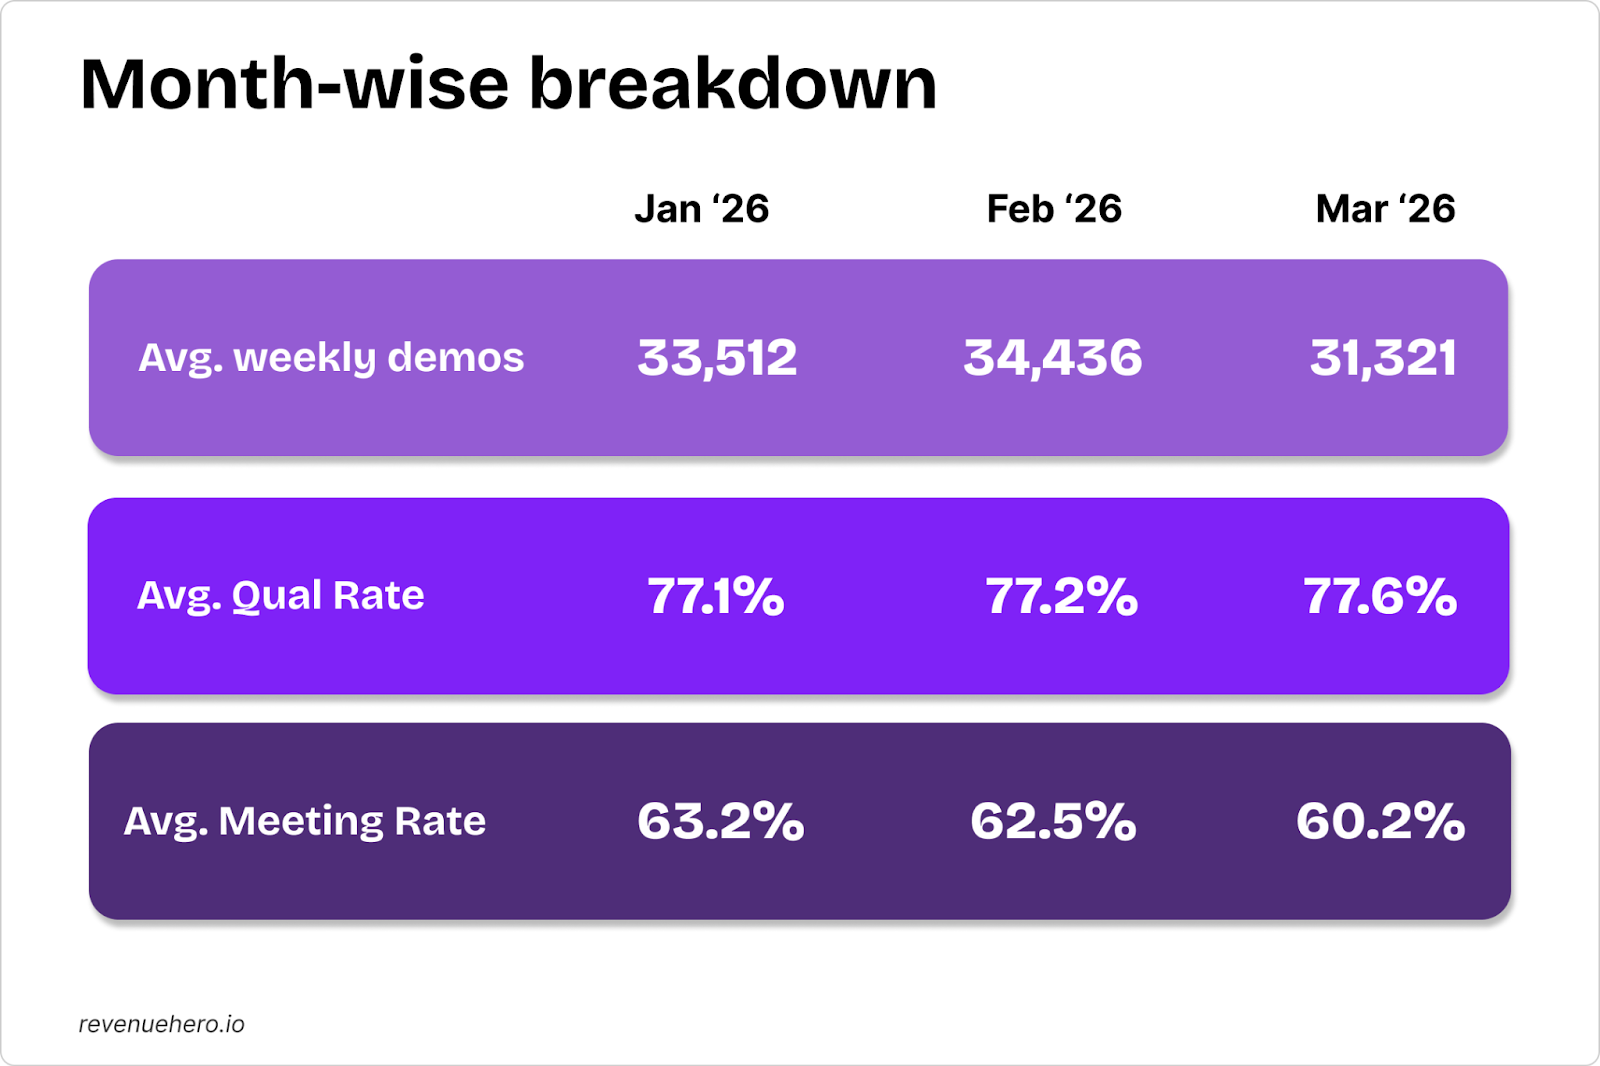
🗓️ Month-on-month comparison
January was the high-water mark for conversions. February held volume, but meeting conversion rates started to slip. March saw a decline in both volume and meeting rates, with weekly demo requests falling to their lowest average of the quarter.
Our analysis of top-performing demo pages found that companies converting at 70%+ aren’t winning only because of faster scheduling; that’s a given for every company in this dataset.
It’s everything that happens before the form.
Sharper ad audiences. Demo pages that qualify before the CTA. Forms that have fields with the right purpose. Content that attracts the ICP and filters out the rest.
So here’s the Q1 takeaway: instant scheduling is a must-have, and the companies that pulled away from the pack were more deliberate about who gets to see the reps’ calendar in the first place.
Onto the regular weekly numbers now ⬇️
Weekly Highlights ✨
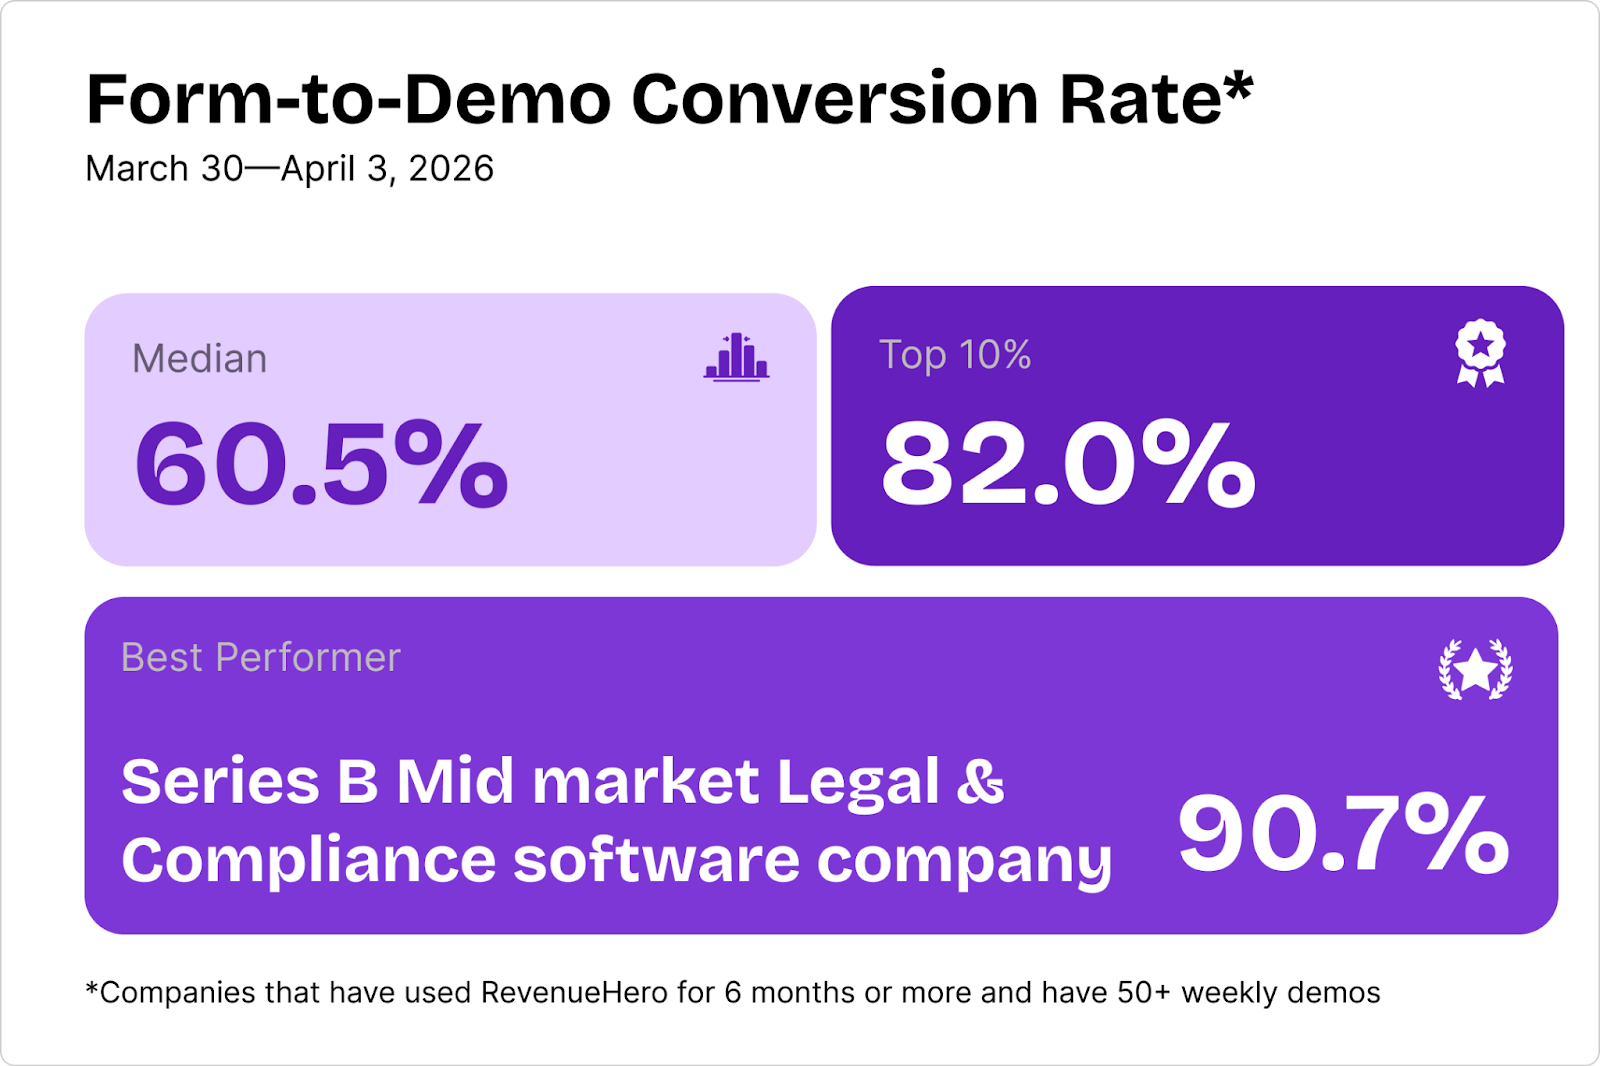
The best performer last week was a Series B mid market legal & compliance software company. Here’s what we learnt from their demo page:
- They use “Book a Demo” as their CTA
- Their demo page displays their product interface in the background, with their demo form as the overlay
- Their demo form has 9 fields, with 3 fields that help them in lead qualification
Inbound Snapshot
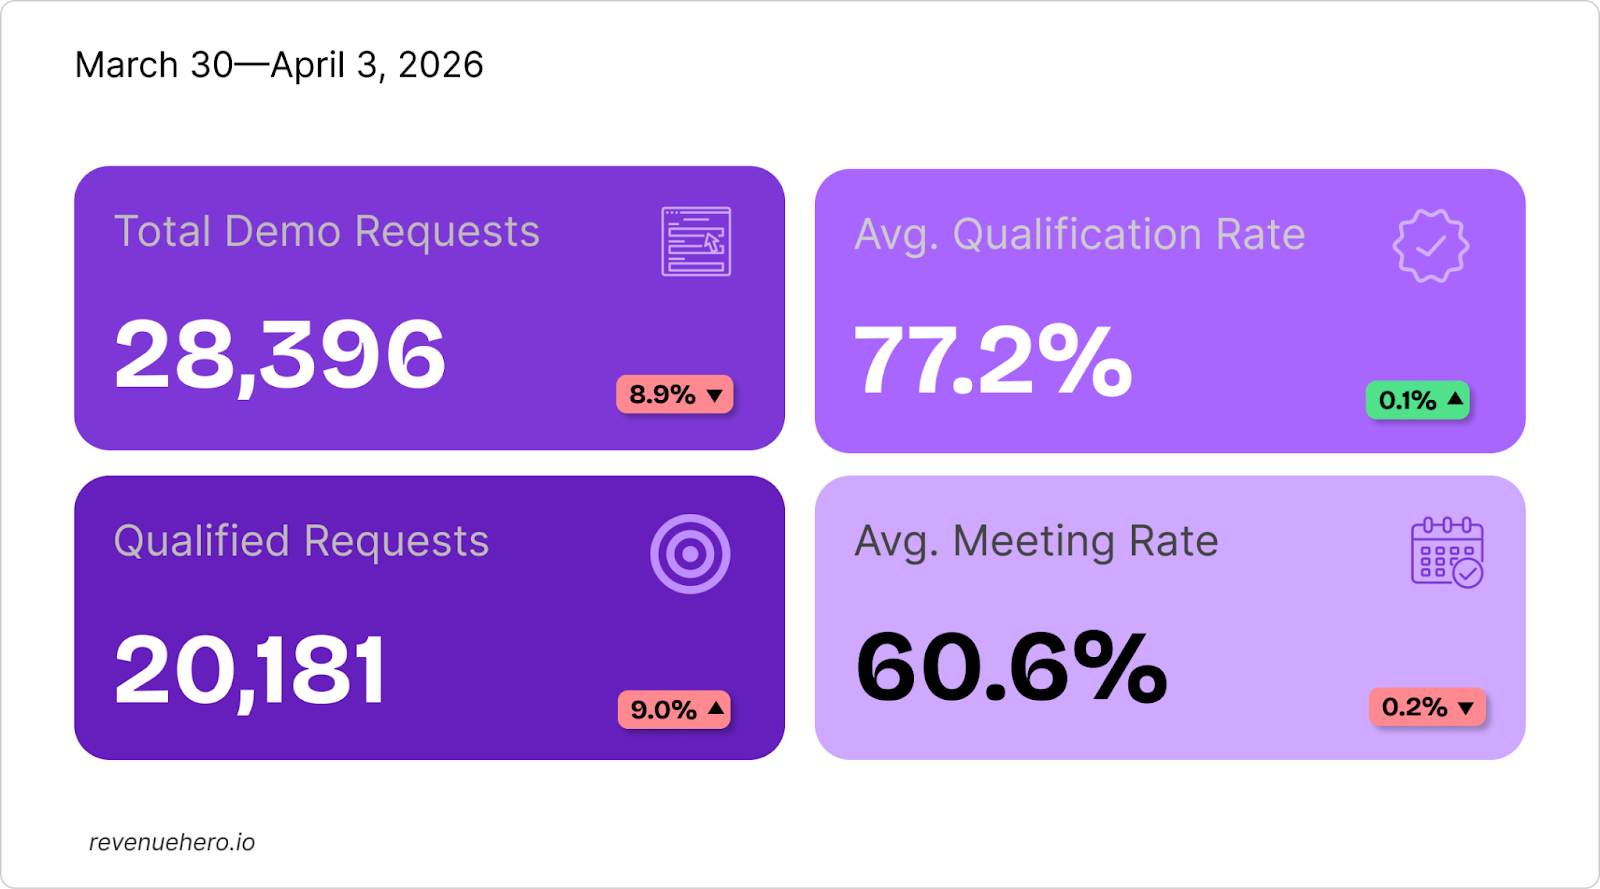
While demo requests dropped 8.9% last week, the funnel held its ground on efficiency. Qualification rates saw a 0.1% uptick, while form-to-demo conversion rates remained steady at 60.6%.
This wraps up a Q1-long trend: demo requests peaked at 37,007 in Week 9, then trended downward for most of the quarter. However, the meeting conversion rates held above 60% for the fourth straight week, unharmed by the decline in demo request volumes.
Segment Snapshot
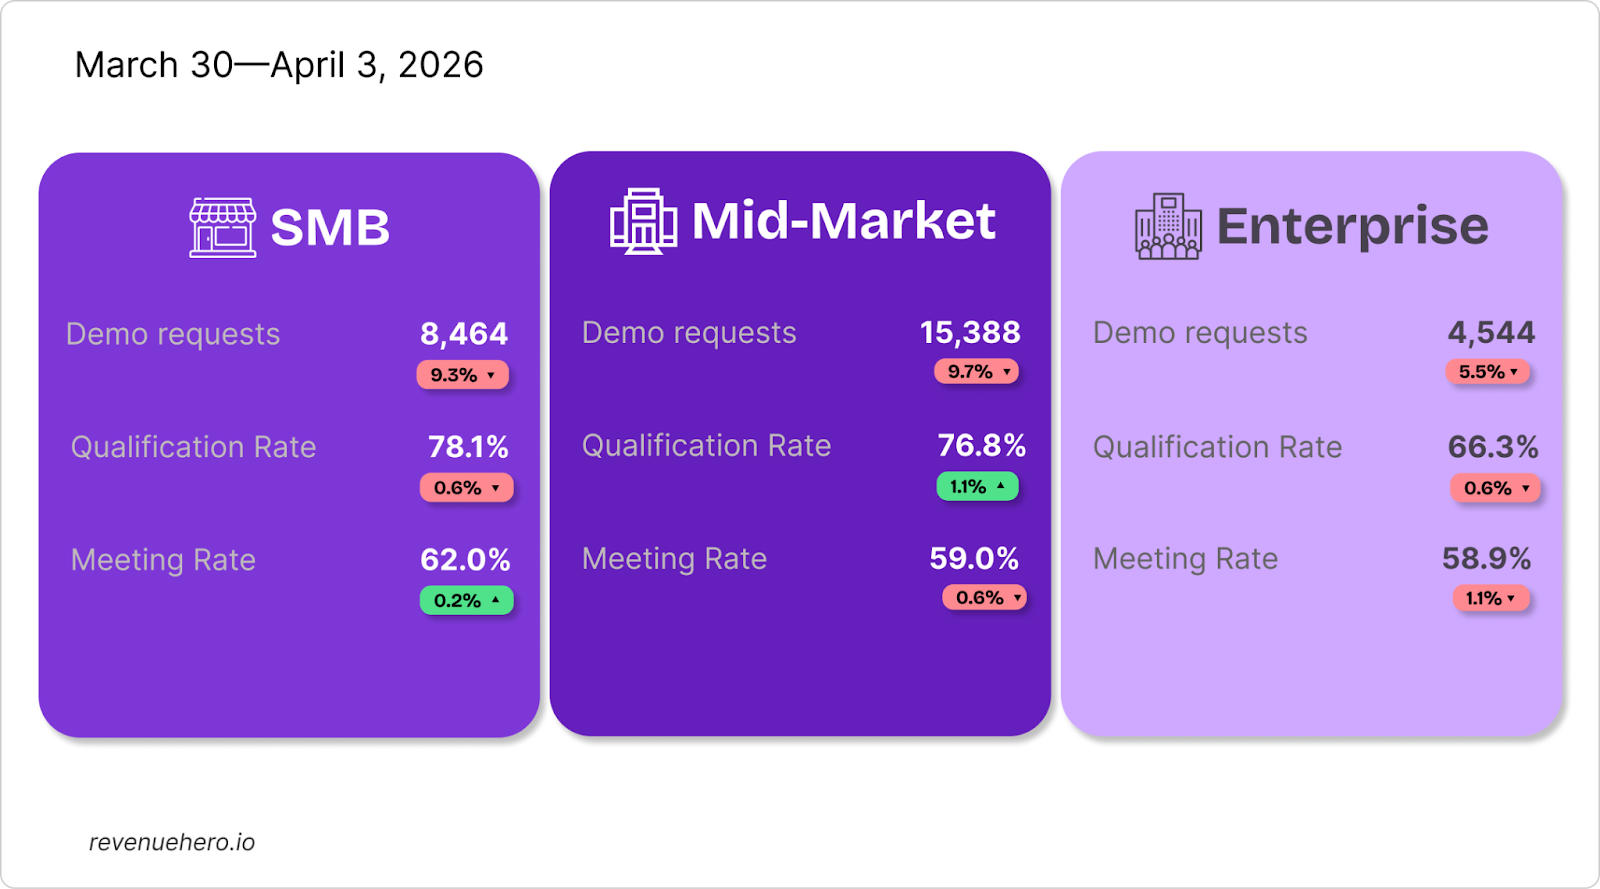
SMB continued the pattern of “doing more with less”. Demo requests dropped 9.3% to 8,464, but qualification rates (78.1%) and meeting conversion rates (62%) remained steady.
Mid market saw the biggest volume pullback last week, with demo request volumes dropping 9.7%. Qualification rates nudged up slightly, while form-to-demo conversion rates remained steady at 59%. The drop in volume neither hurt nor helped conversions.
Enterprise also witnessed a 5.5% decline in demo request volumes last week. Despite steady qualification rates, its form-to-demo conversion rates saw a 1.1% downtick.
Funding Stage Analysis
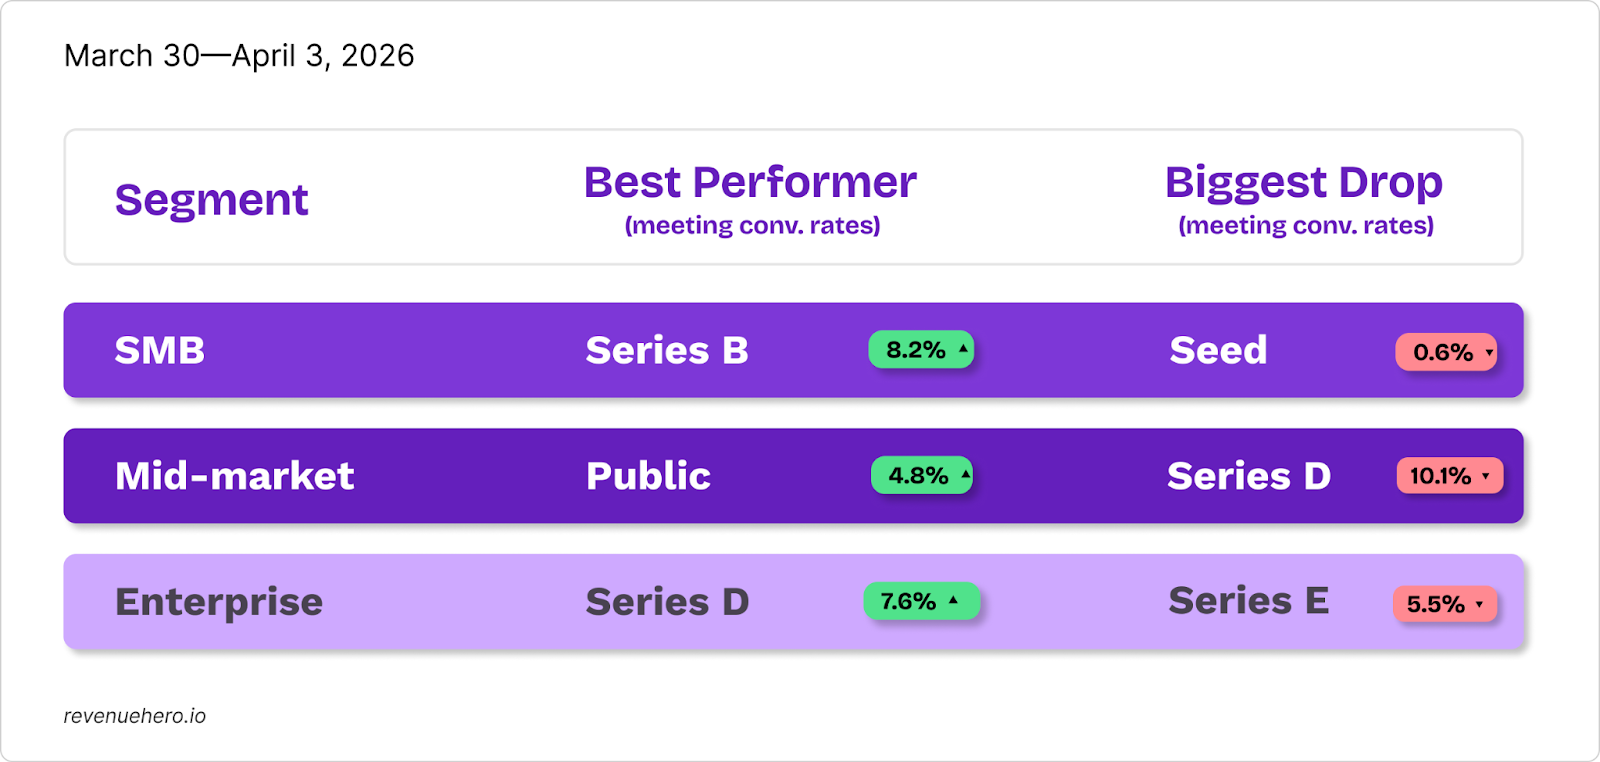
SMB Series B jumped 8.2% to 67.7% last week, while SMB Series C jumped 7.1% to 79.3%, continuing its run as the highest-converting SMB cohort all quarter. Enterprise Series D spiked 7.6%, recovering from last week.
On the other end, Mid-market Series D plummeted 10.1%, erasing last week’s gains. Enterprise Series E dropped 5.5%, but the cohort is performing well with an average form-to-demo conversion rate of 78%.
Industry-wise Meeting Rates
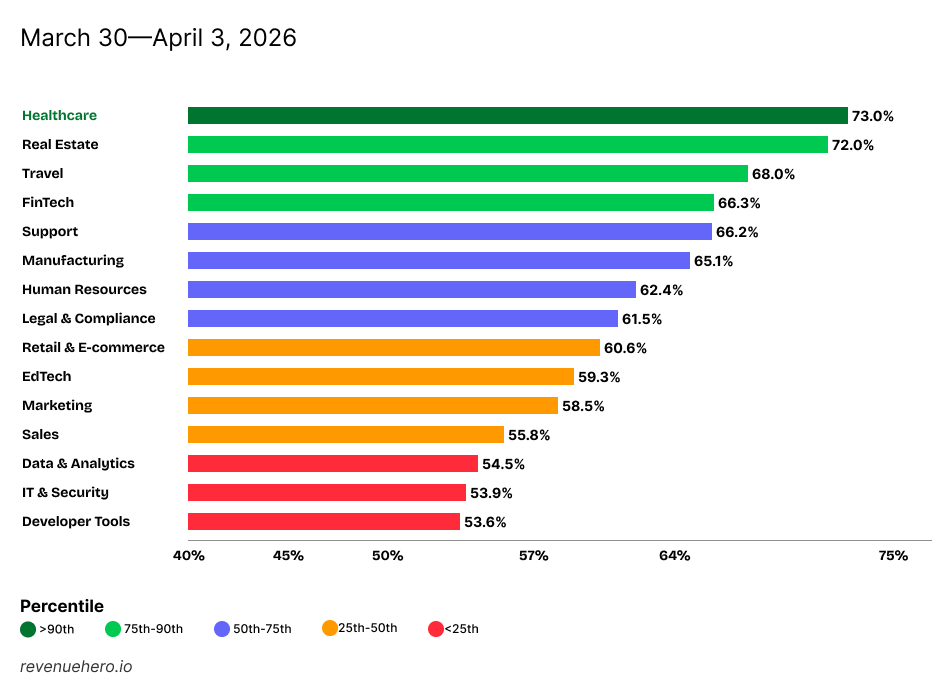
Support skyrocketed 18.4% to 66.2%, the biggest single-week increase in the history of Breaking Inbound. Healthcare reclaimed the top spot with a 6.6% surge, while EdTech soared 10.2% to pull itself above the 50% conversion rate line.
Sales tumbled down 9.2%, while IT & Security saw a 5.8% drop, falling below the 25th percentile for the first time in Q1 2026. Data & analytics also saw a 2.6% decline last week.
All industries, however, converted 50%+ of their qualified inbounds into booked meetings, with 73% of industries witnessing steady or better form-to-demo conversion rates.
Top Performers
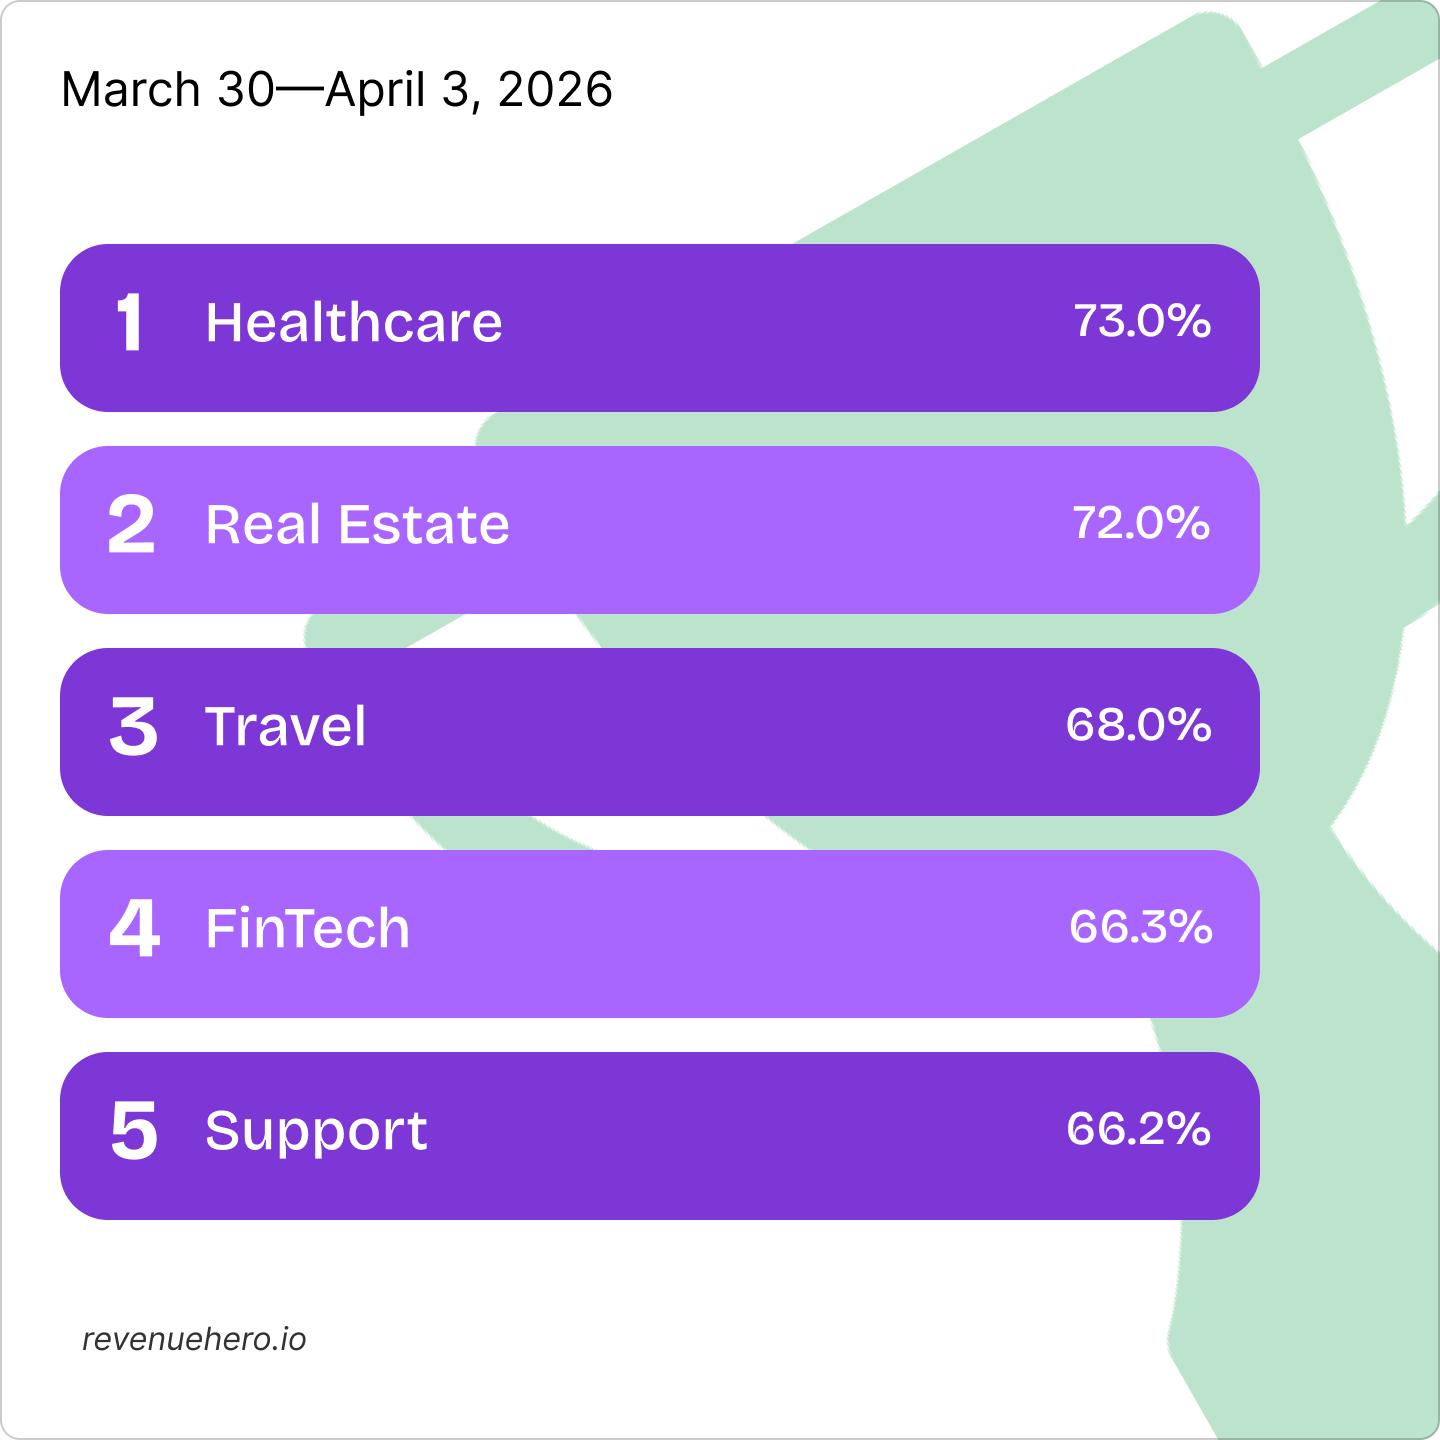
Healthcare snatched the crown from real estate, which came second with a 72% average form-to-demo conversion rate. Travel completed the podium with a conversion rate of 68%.
Key Observations
- Q1 2026 closed with 428,000+ demo requests across 13 weeks. Meeting rates peaked at 64.4% in Week 8, then declined to 60.6% by Week 17. Qualification rates held flat at 77.3% throughout. The bottleneck was the gap between qualified and booked.
- Healthcare dominated Q1, holding the #1 industry spot in 6 out of 13 weeks: It finished the quarter at 73%, 10.1% up from where it started in Q1.
- Data & analytics suffered the biggest dip in Q1: It collapsed 15.4% from its starting value of 69.9%, ending Q1 at 54.5%.
- FinTech’s seven-week loss streak is over: After falling from 78.2% to 61.0% through seven weeks, FinTech finally jumped 5.3% to end Q1 at 66.3%
- Demo volume hit a Q1 low last week, but meeting rates held steady at 60.6%. The funnel shrank without breaking.
- SMB led the form-to-demo conversions at 62% despite a 9.3% volume drop. Enterprise ticked down 1.1% to 58.9%, while mid-market remained steady at 59%.
- SMB Series B jumped +8.2% to 67.7%, its best reading ever. Mid-Market Series D plummeted -10.1% to 53.2%.
- Support soared 18.4% to 66.2%, the largest single-week industry move in Breaking Inbound’s history. Sales dropped 9.2%, while IT & Security dropped below the 25th percentile for the first time in Q1.
- Healthcare claimed the top spot at 73%, followed closely by real estate at 72%. Travel dropped down a spot, completing the podium with a 68% form-to-demo conversion rate.
We'll be back next week with a fresh batch ✨
Until then, keep those meetings flowing 📈


