


Welcome to the ninth edition of Breaking Inbound, your weekly deep-dive into inbound numbers and form-to-demo conversion rates across industries.
Let’s talk about the fintech industry.
Fintech is poised to become a 460-billion-dollar industry in 2026. However, it’s afflicted by what we call the “ex”-trifecta:
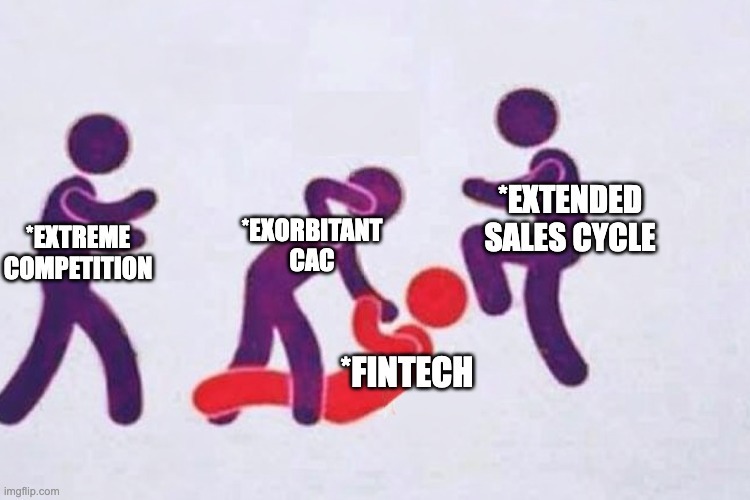
Challenge #1: Ex-treme competition
As of 2025, there are 30,000+ fintech companies all over the globe. The competition is as fierce as a belligerent bobcat, so it’s an underestimation to call fintech a “cutthroat” industry.
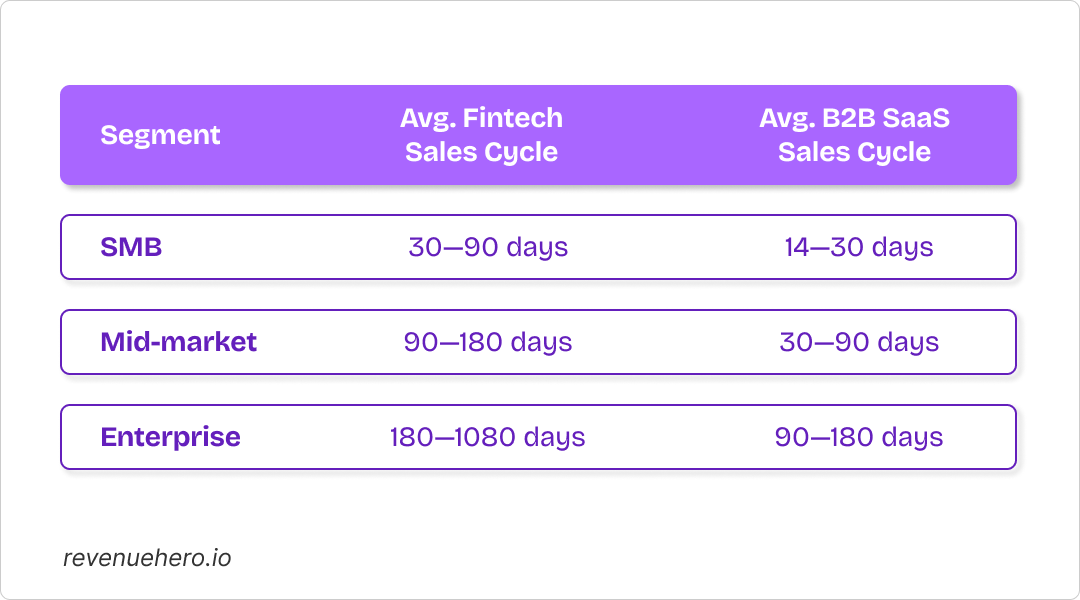
Challenge #2: Ex-tended sales cycle
Compared to the median B2B SaaS cycle (~84 days), fintech has an extremely long sales cycle, spanning anywhere between 1 to 18 months—depending on the company size.
Fintech buyers are meticulous—they don’t buy simply because your product works. They buy if it doesn’t hurt their credibility. If you’re able to neutralize all these risks:
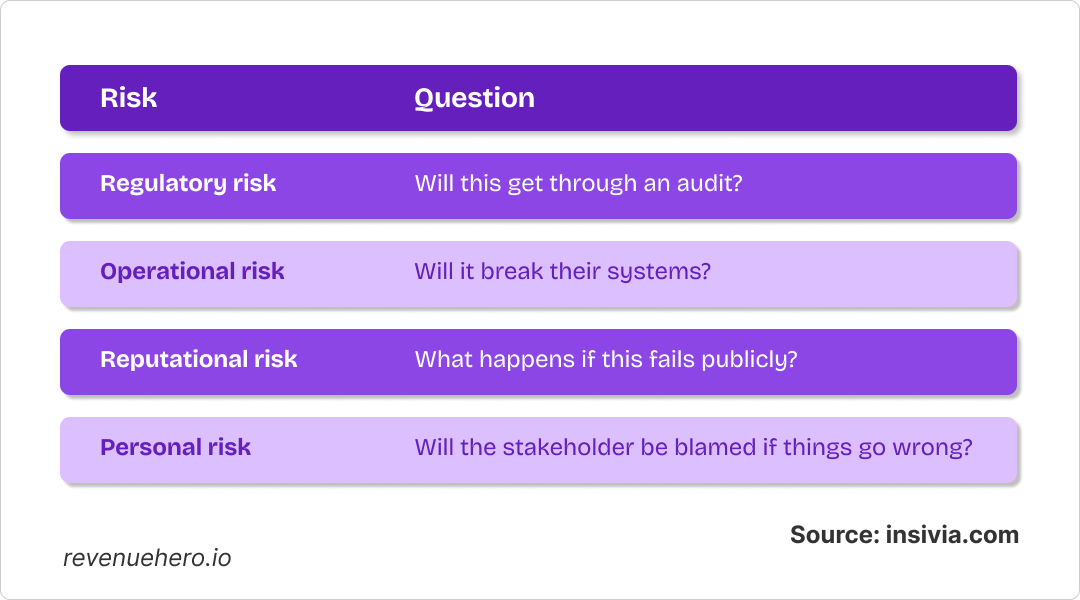
Since each risk requires significant due diligence, the sales cycle lengthens.
Challenge #3: Ex-orbitant CAC
The average customer acquisition cost CAC for an SMB fintech company is $1,450, while the B2B SaaS average is $702.
Let that sink in.
Moreover, the average CAC increases as the company size increases: ~$5,000 for a mid-market fintech company, and a whopping ~$14,800 for an enterprise company!
This is why most fintech CEOs, ops teams, and marketing folks look like this:

Now imagine if you’re a fintech company that cuts down CAC with a simple strategy.
You’d think we’re being ridiculous, but we have the proof—when we saw what our fintech customers were doing:
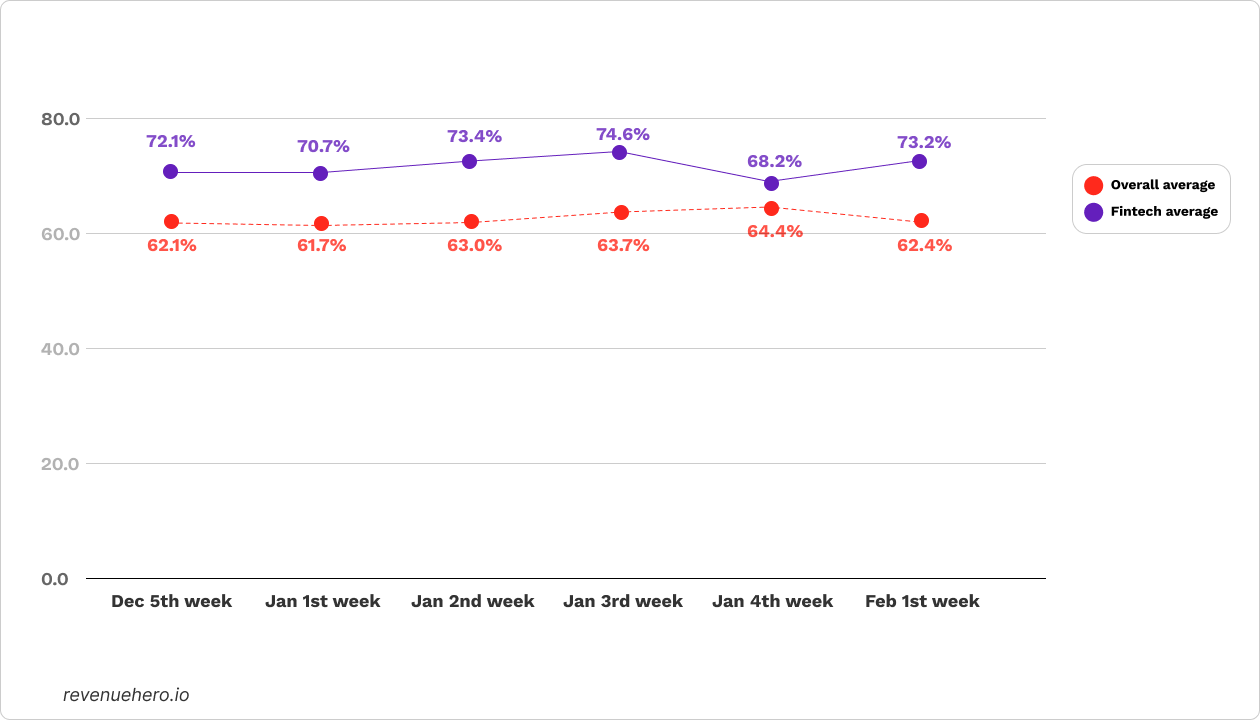
- Fintech has been in the top 5 industries for 6 consecutive weeks
- In 5 out of those 6 weeks, they were converting at above 70% on average
- 63% of our fintech customers converted 70%+, whereas 29% converted 80%+
They know the gospel: every lead counts.
And they’re getting 40–50% more sales conversations each week, compared to the antiquated benchmark of 30%. (Psst! Here are the latest benchmarks. Thank me later 😉)
So what are they doing differently? And how can you apply these lessons to your company—or maybe, help a friend in your network who’s scratching their head for a “growth hack”?
Dive in for the full scoop (and for the usual weekly numbers! ✨)
How RevenueHero Fintech customers maintained 70%+ inbound conversion rates
We tracked the data for the last 6 weeks, and we noticed that RevenueHero fintech customers always hit above-average form-to-demo conversion rates:
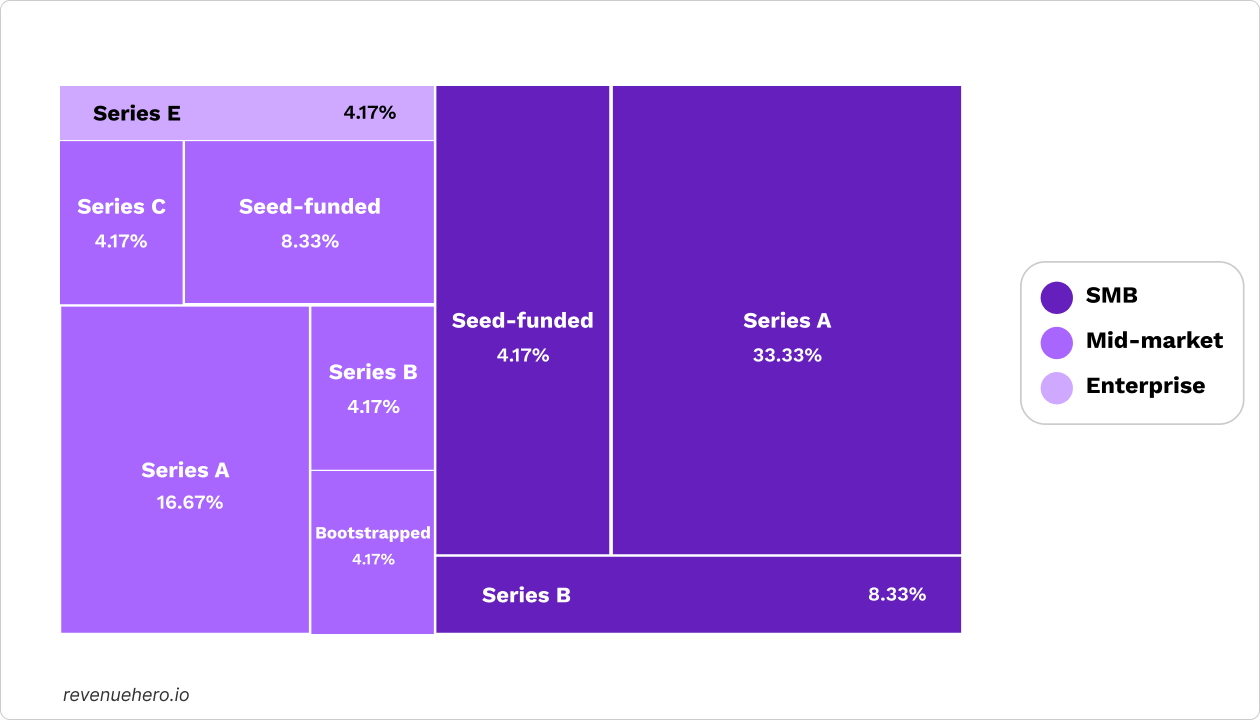
Here’s a broader distribution based on company size and funding status:
We dug a little deeper and analyzed their demo landing pages and forms. Here’s what we
found:
Observation #1: High-performers craft killer CTAs
Take a look at the top 5-performing demo page CTA copy:
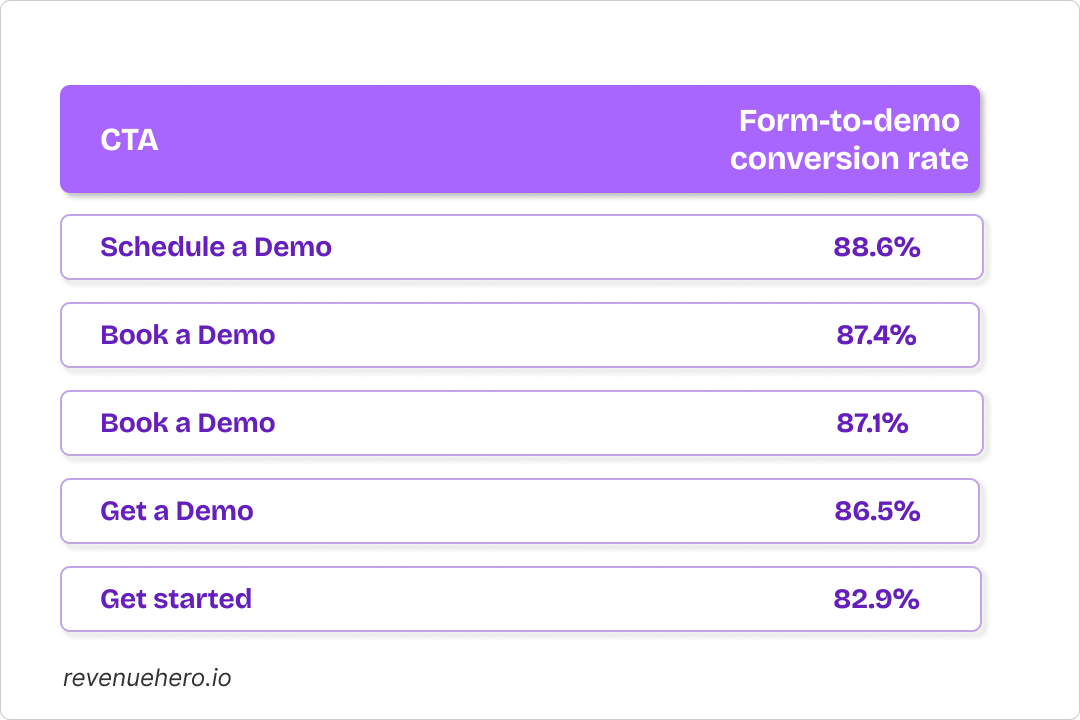
Action words like “Schedule”, “Book” and “Get” perform extremely well, because they indicate certainty. Words like “Request” paint an image of uncertainty in the prospect’s mind.
Observation #2: High-performers display specific social proof
Customer logos and testimonials with specific results are tied as the most common forms of social proof—each used by 60% of companies hitting 70%+ form-to-demo conversion rates:
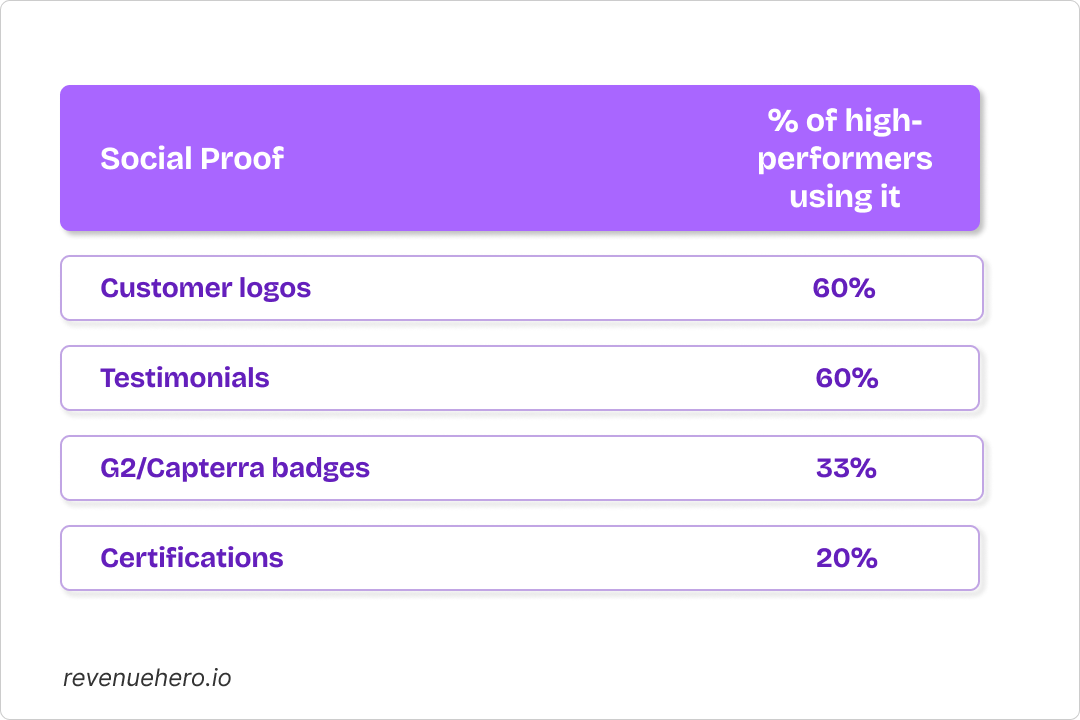
G2/Capterra badges and certifications (SOC2, GDPR, etc.) are underutilized, but those are highly recommended as well.
Observation #3: High-performers use a qualifying form field
How many form fields is too many?
Well, sorry to burst your bubble, but it doesn’t matter.
Field quantity has always been considered a conversion killer. But the truth is a gray area: too many fields can be redundant, but fields that don’t serve any purpose are no better.
Most of our fintech customers use a qualifying form field, such as:
- Product of Interest: Helps route the lead to the right rep
- Use Case: Helps in routing the lead as well as personalizing the demo
- Job Title: Helps in identifying if the lead is the right ICP
- Tech stack-related query: Helps in personalizing the demo as well as during implementation
Recommendations
- Use action words like “Book”, “Schedule”, or “Get” in your primary CTA.
- Plaster your demo page with specific social proof: customer logos, testimonials with specific results, badges (G2, Capterra), and certifications.
- Go through your form fields and make sure you have one field that helps in routing the lead or personalizing the demo.
Final thoughts
Fintech is brutal—you’re fighting for attention along with 30,000 competitors, while watching your CAC balloon to $14,800 (if you’re enterprise).
But, while everyone’s out there chasing the next growth hack, some of your peers are winning by converting more of the leads they already get. Same spend, same leads, just better demo pages.
If you’re in fintech, bear in mind that letting leads slip through because of a weak CTA or a confusing form is costing you $1,450 a pop. That’s expensive.
Optimize your fields. Fix your demo page. Oh, and get RevenueHero while you can 😉
Onto the regular weekly numbers now ⬇️
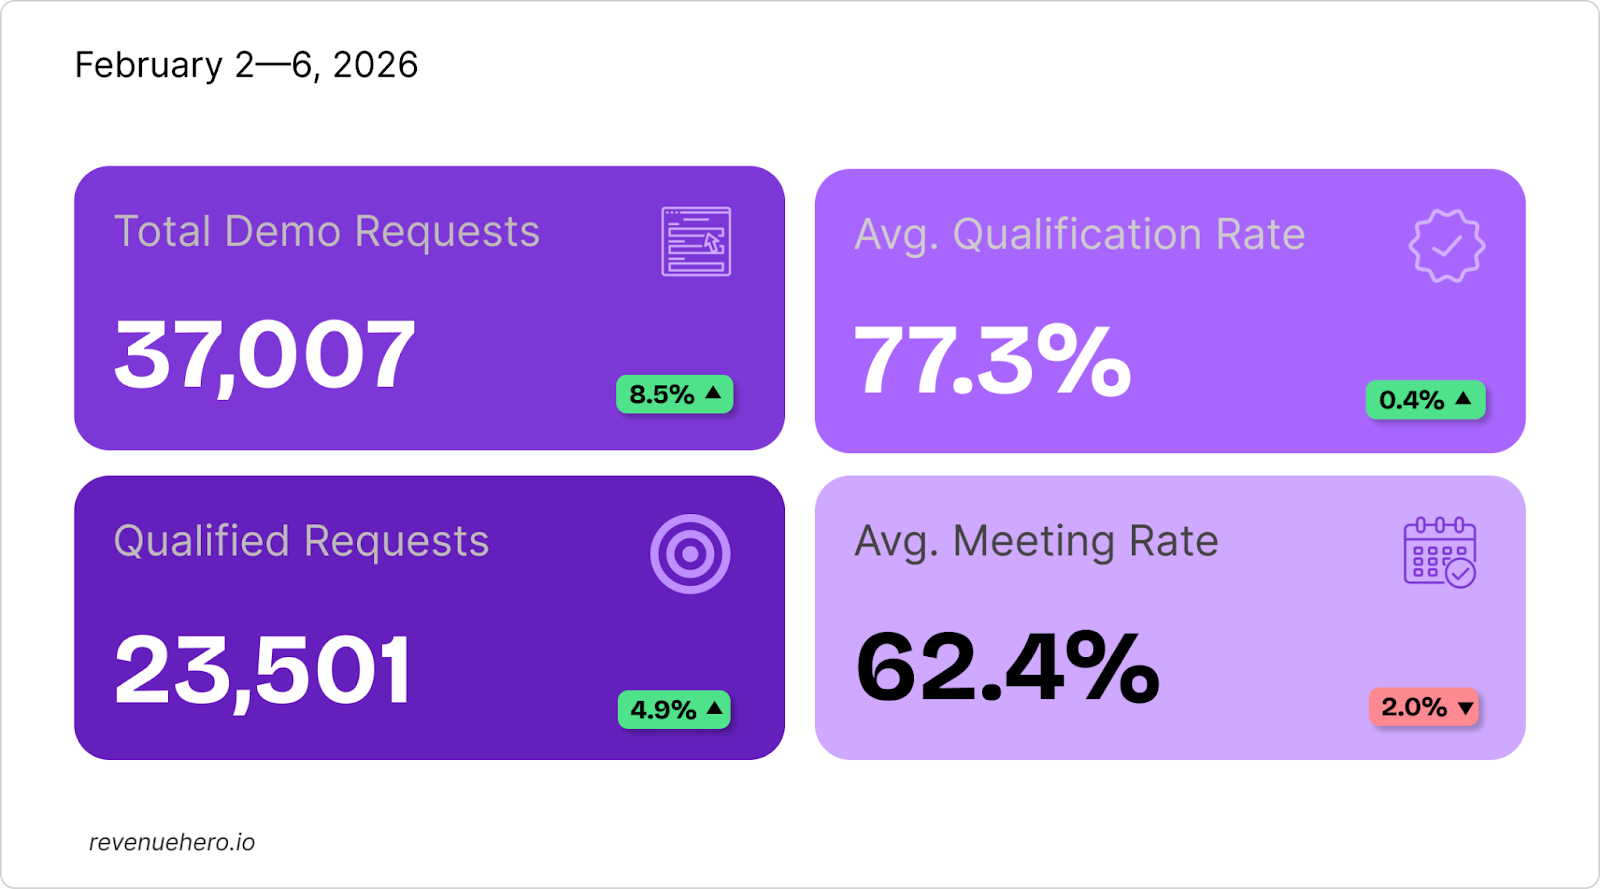
Inbound Snapshot
- Demo request volumes saw an 8.7% boost (37007 vs. 34046 prev. week)
- Qualified demos saw a 4.9% spike (23501 vs. 22403 prev. week)
- Qualification rates remained relatively steady (77.3% vs. 76.9% prev. week)
- Meeting rates dipped 2% (62.4% vs. 64.4% prev. week)
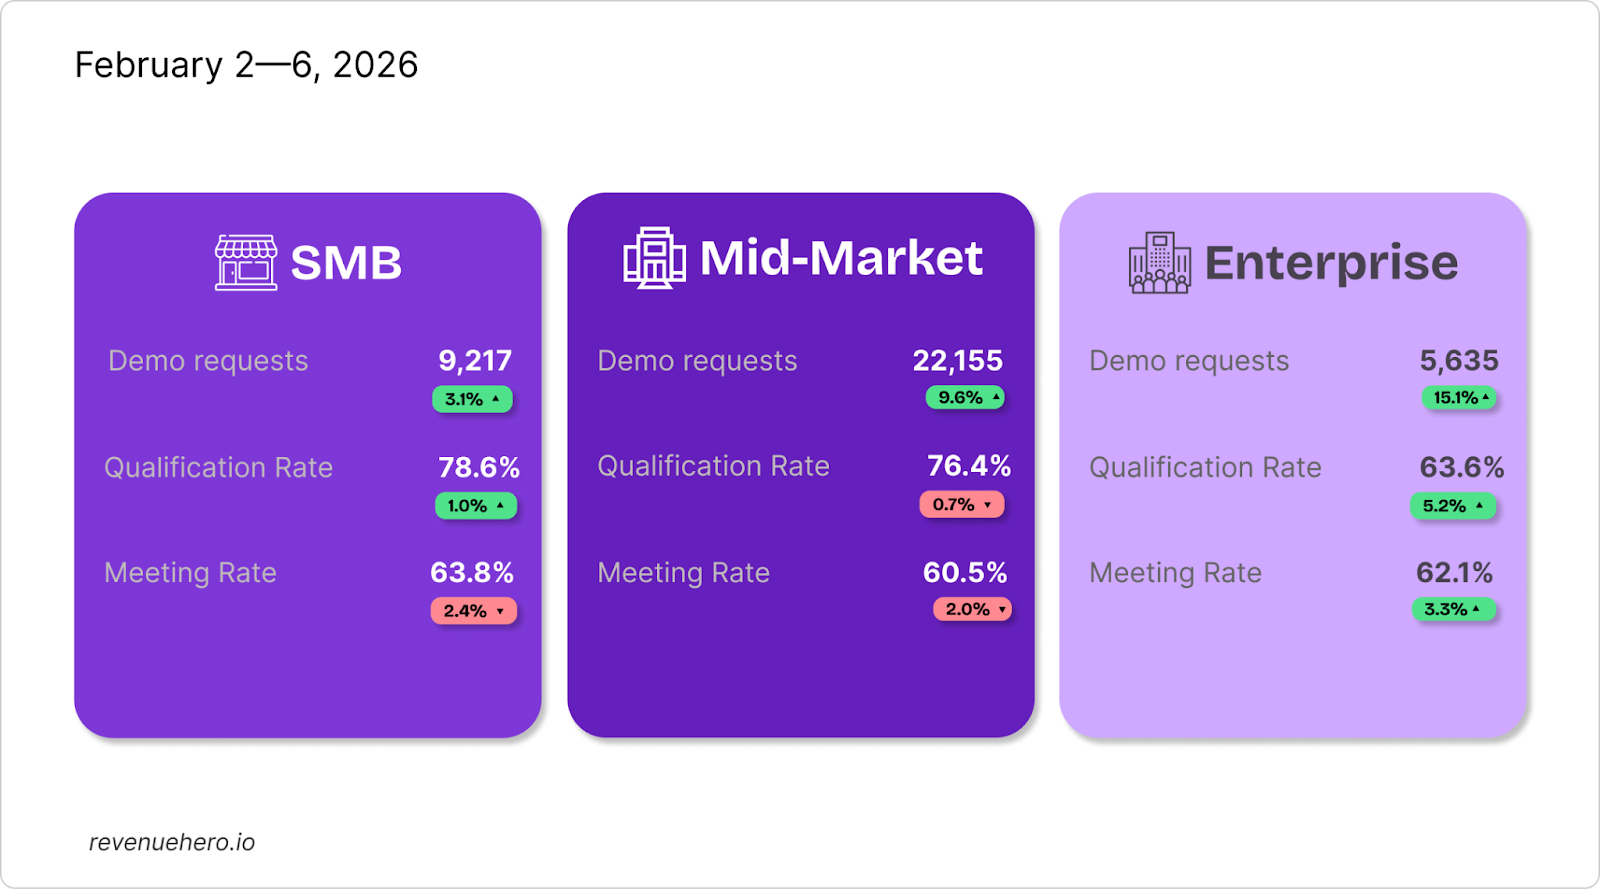
Segment Snapshot
- More demo requests flowed in across segments: SMBs saw a 3.1% spike last week, mid-market got 9.6% more demos, and enterprise saw the strongest surge of 15.1%.
- SMBs slipped a little: SMB companies saw a 2.4% dip in form-to-demo conversion rates, despite improving qualification rates by 1%.
- Mid market missed out as well: Mid-market companies also witnessed a 2% drop in form-to-demo conversion rates, but maintained steady qualification rates.
- Enterprise excelled throughout: Enterprise companies improved their form-to-demo conversion rates by 3.3%, while improving their qualification rates by 5.2%.
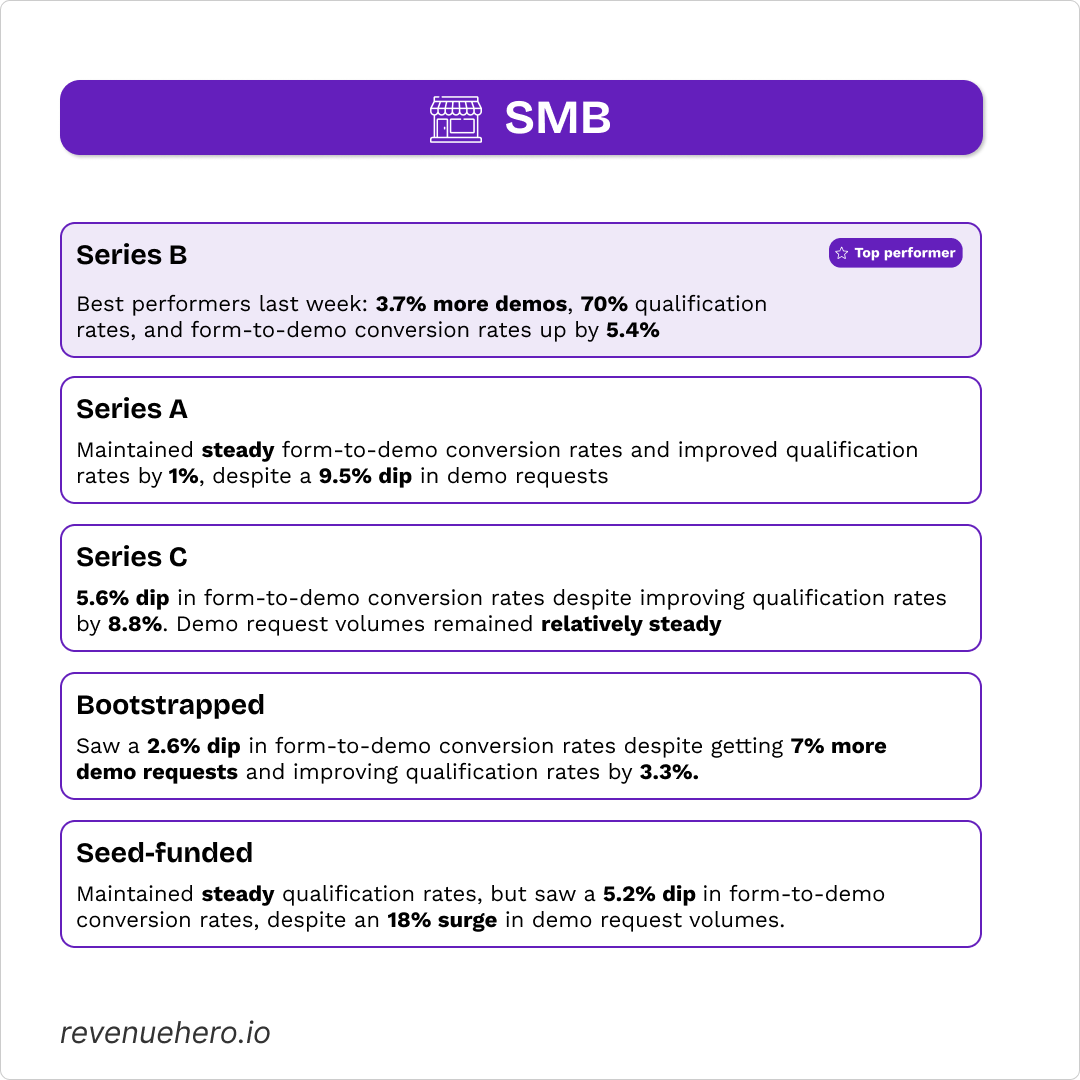
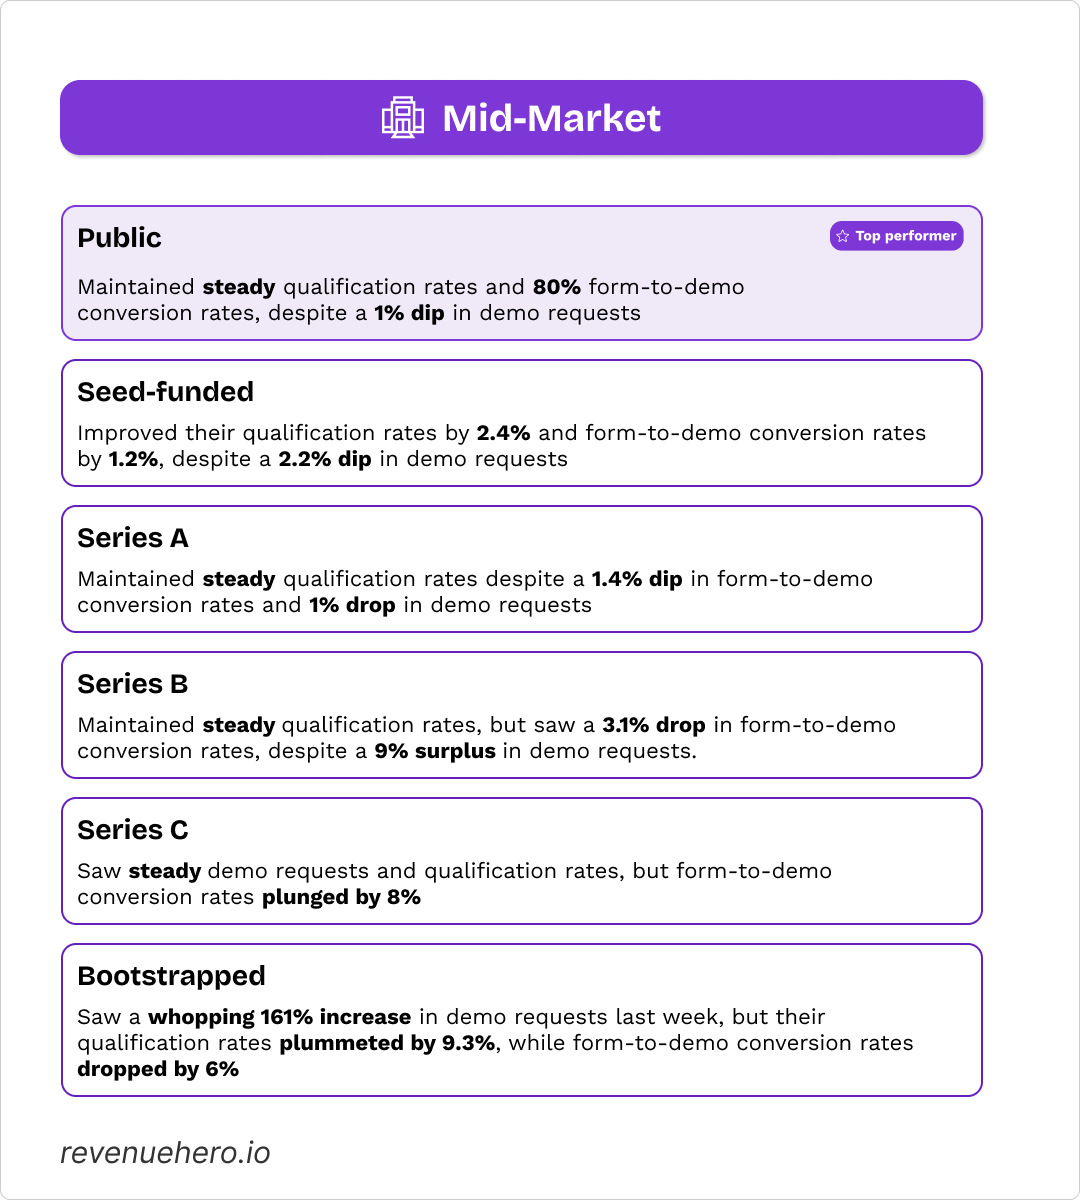
Funding Stage Analysis

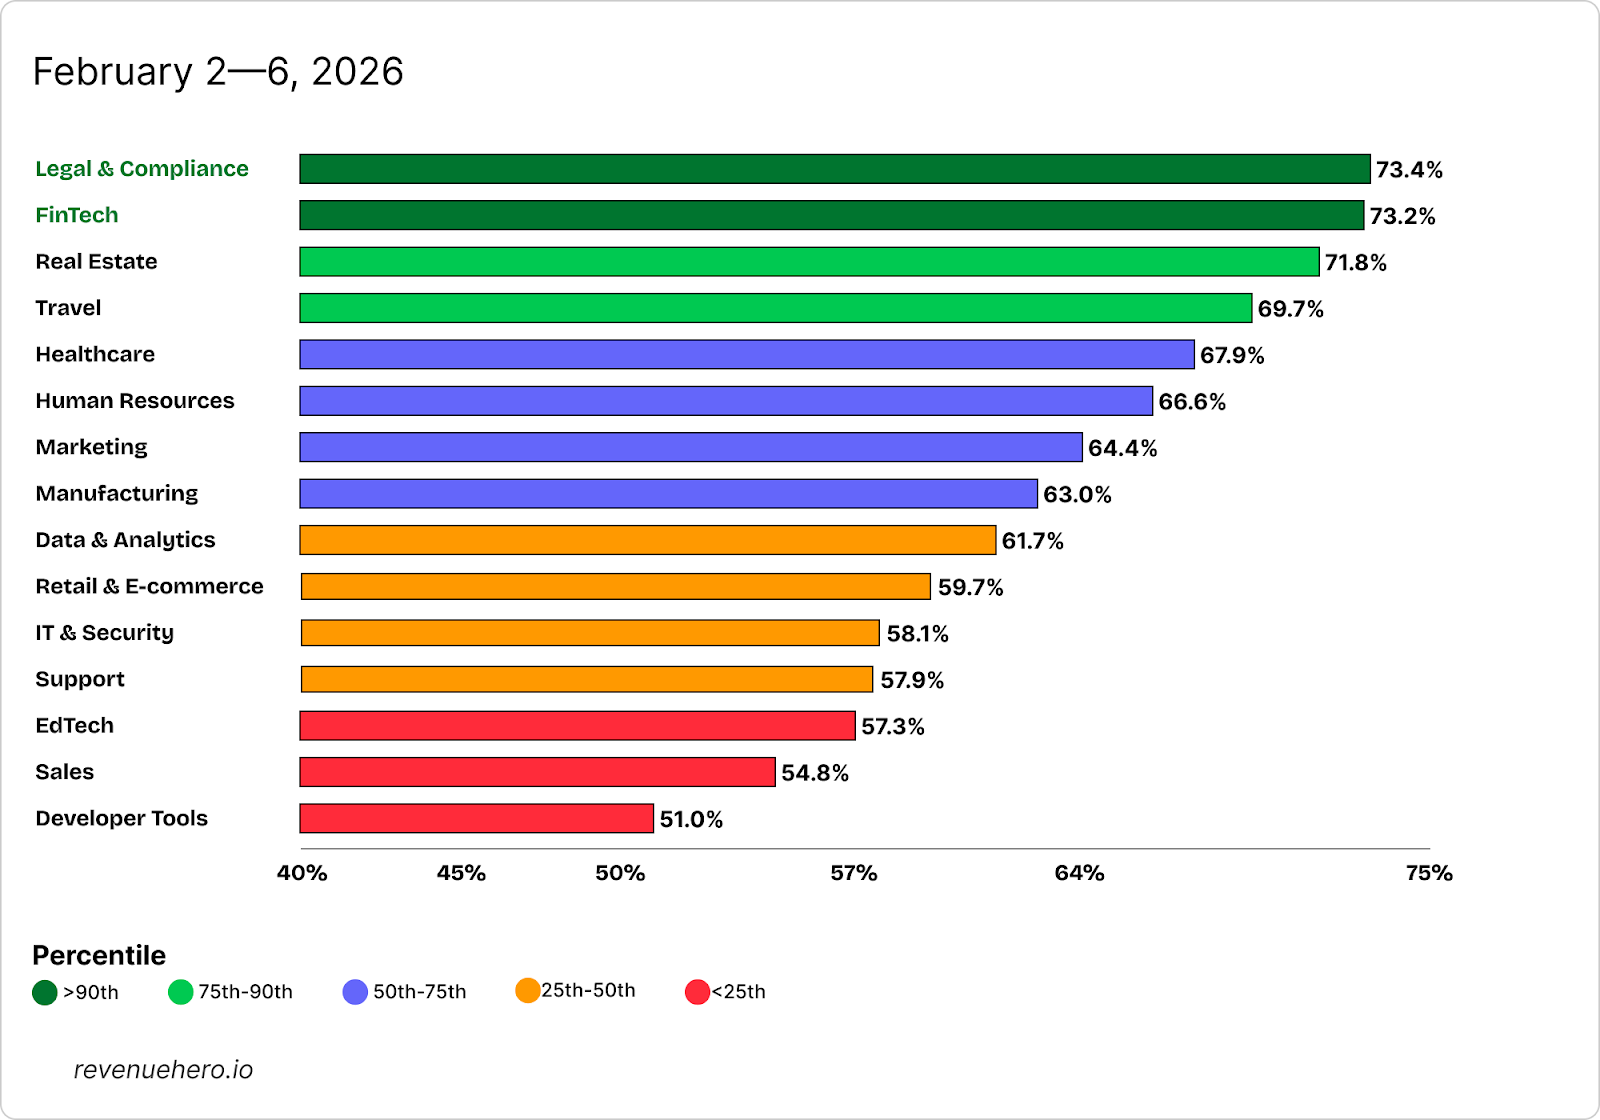
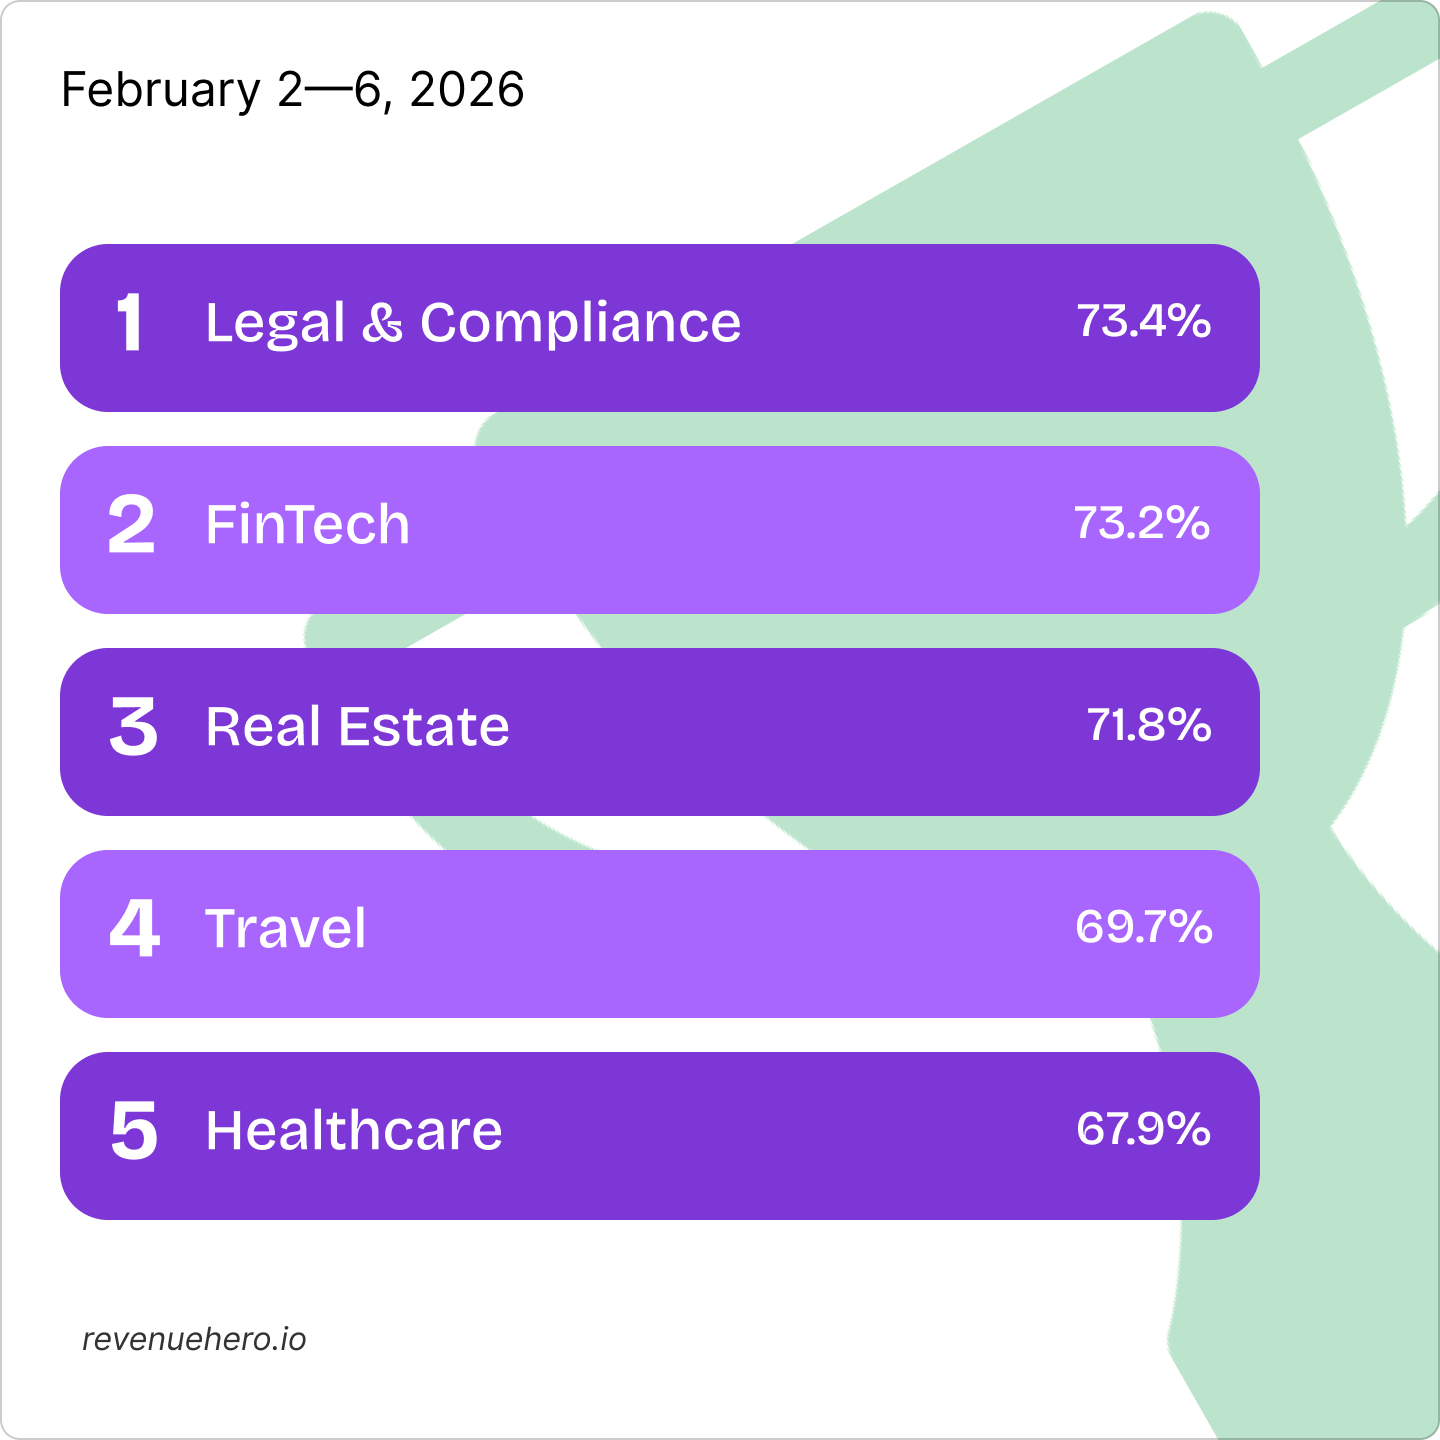
Industry-wise Meeting Rates
- All industries converted more than 50% of their demo requests into meetings.
- Legal and compliance software gave a comeback, with form-to-demo conversion rates surging to 73.4%, taking the first position.
- Real estate saw the next biggest spike with 9.3%, moving to the #3 spot with an overall 71.8% form-to-demo conversion rate.
- Sales software saw the biggest dip last week, dropping 11%
- Only 33% of companies saw steady or better form-to-demo conversion rates last week.
Top Performers
Legal & compliance climbed up to the top spot, with a form-to-demo conversion rate of 73.4%✨
Key Observations
- Demand rebounded, but conversion took a hit: Demo requests rose 8.7% WoW and qualified demos grew 4.9%, but inbound conversion rates dropped 2%.
- SMBs slipped on meetings: Qualification improved to 78.6%, but form-to-demo conversion rates fell by 2.4%, suggesting follow-up or capacity pressure.
- Mid-market mirrored the same pattern as SMBs: Strong volume growth paired with a 2% drop in inbound conversion rates, even as qualification stayed steady at 76%.
- Enterprise was the exception: Improved both qualification (+5.2%) and meeting conversion (+3.3%), making it the only segment to convert better under higher demand.
- The industry leaderboard flipped sharply: Legal & compliance surged to the top with 73.4% form-to-demo conversion rate, claiming the top spot.
- Legal & Compliance and Financial & Accounting were the only industries above the 90th percentile, with Real Estate firmly in the next tier.
- Biggest winners: Legal & Compliance (+10.5%), Real Estate (+9.3%) and Financial & Accounting (+5.1%)
- Biggest drops: Sales Software (-11%), IT & Security (-7%), and HR Software (-4.6%)
- SMB Series B stood out, the only cohort to improve meeting conversion (+5.4 pts) alongside volume growth.
- Bootstrapped mid-market companies exploded in volume (+161% demos) but paid for it with sharp drops in qualification and meetings.
This was a scale-first week: demand accelerated hard, but meeting efficiency broke across SMB and Mid-Market, but Enterprise emerged stronger.
In case you missed out on our Inbound Conversion Benchmark 2025 report (based on 1M+ inbound form submissions):
We’ll be back with next week’s numbers ✨
Until then, keep those meetings flowing 📈


